

We designed the report as a visual storytelling product—treating layout, illustration, and information design as core tools for comprehension (not decoration).
- ClientCouncil of European Municipalities and Regions
- WorkReport design, illustration and data visualisation
- Timeframe2024
- StatusPublished
The work
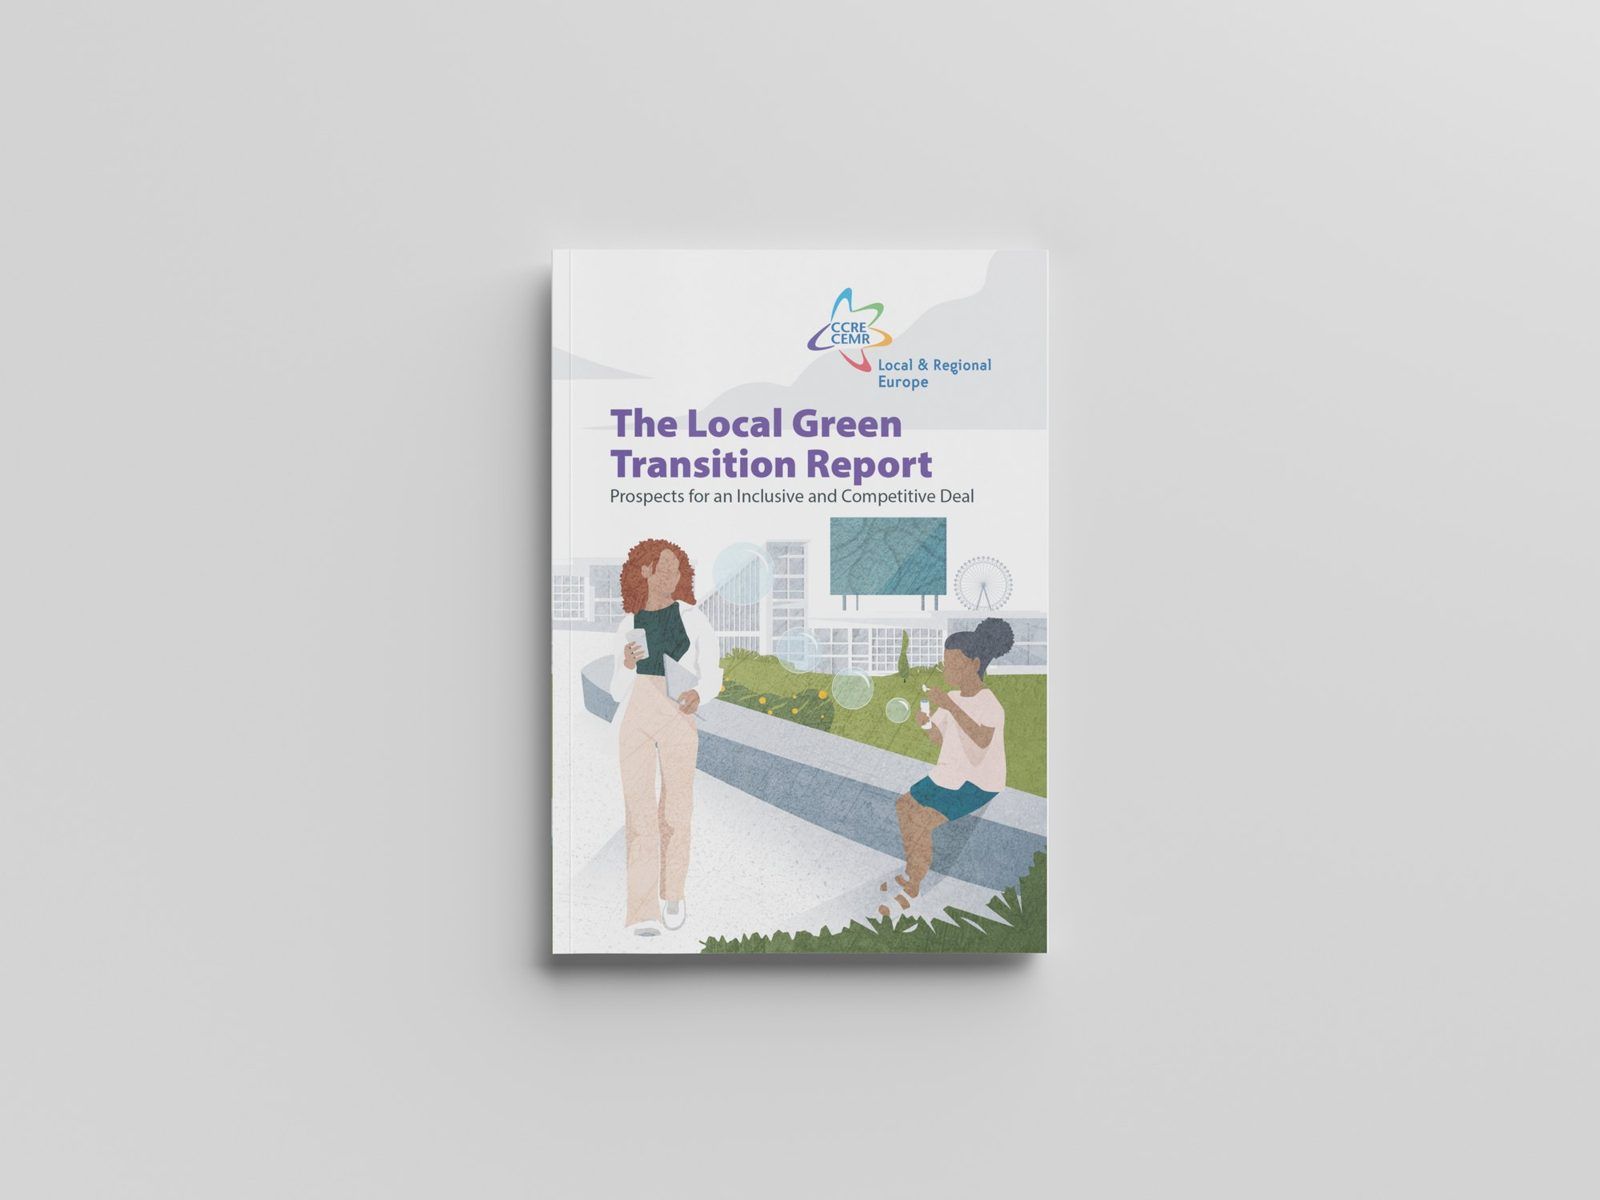
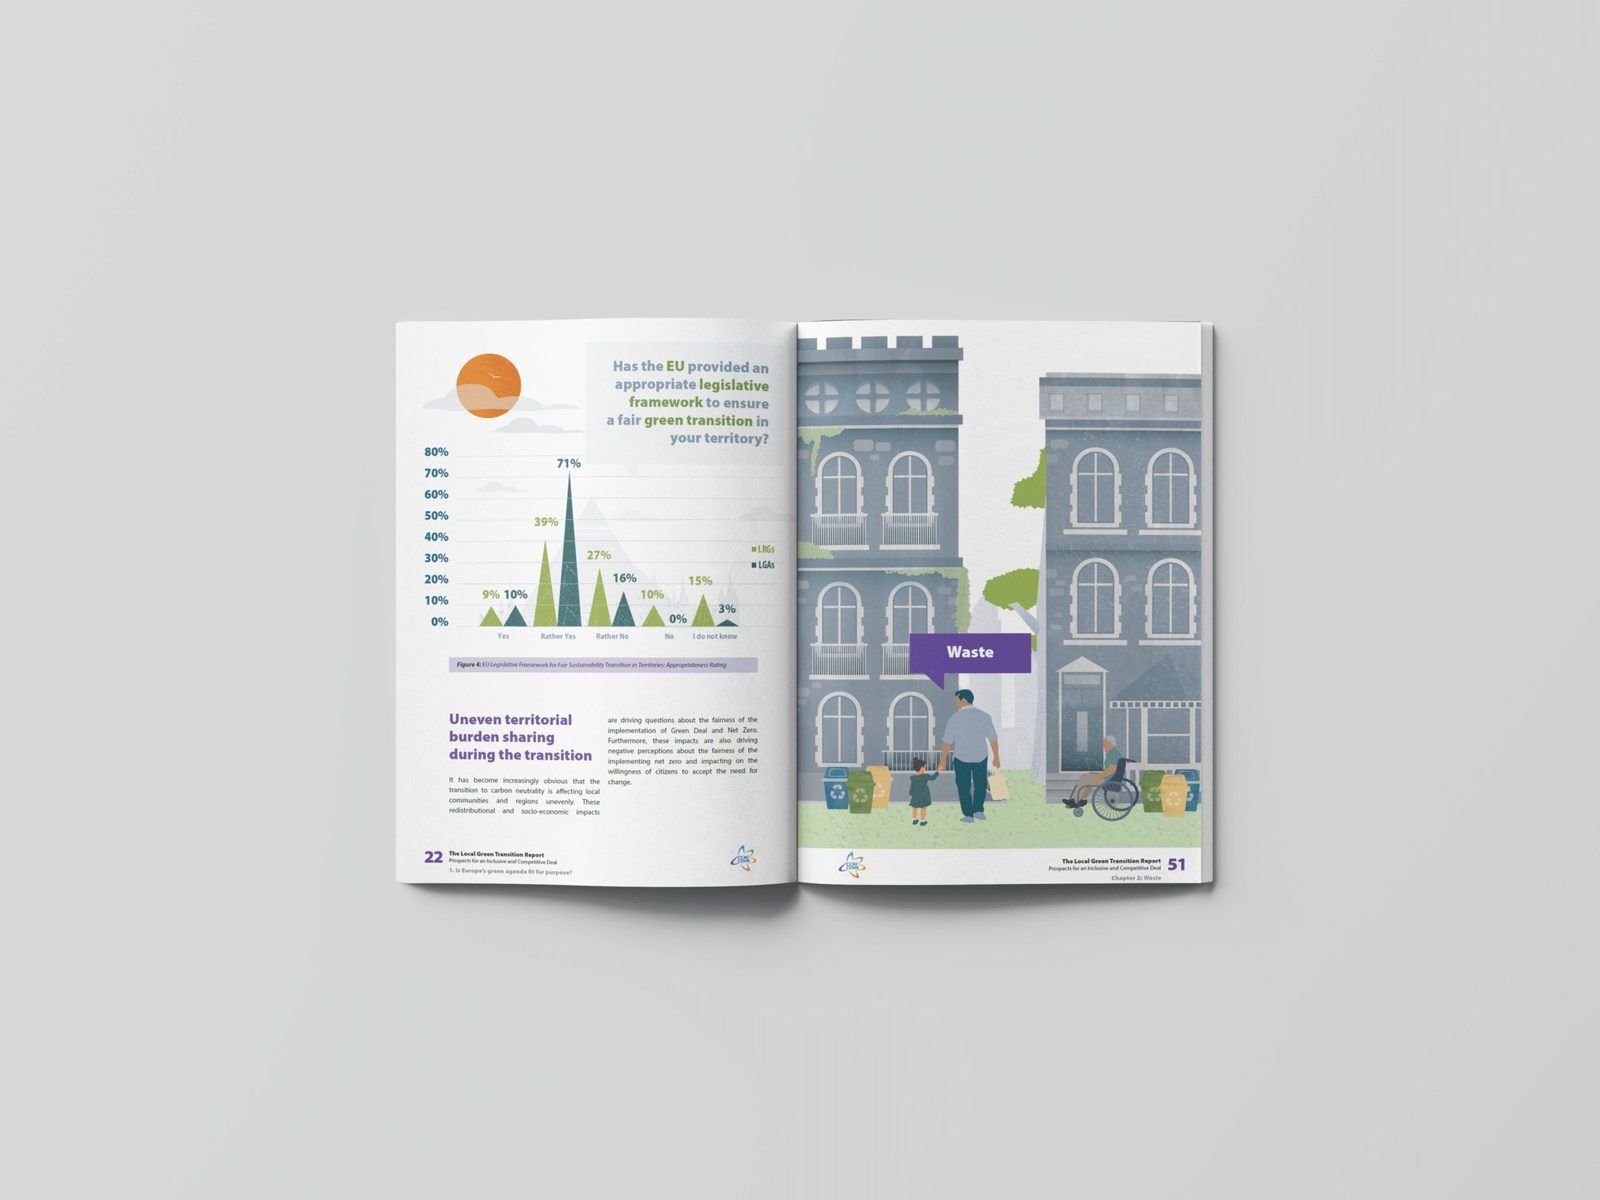
01The structure was built for fast navigation and layered reading, combining an analytical section with a practical reference section that provides a snapshot of 14 EU legislative files and their implications for municipalities and regions.
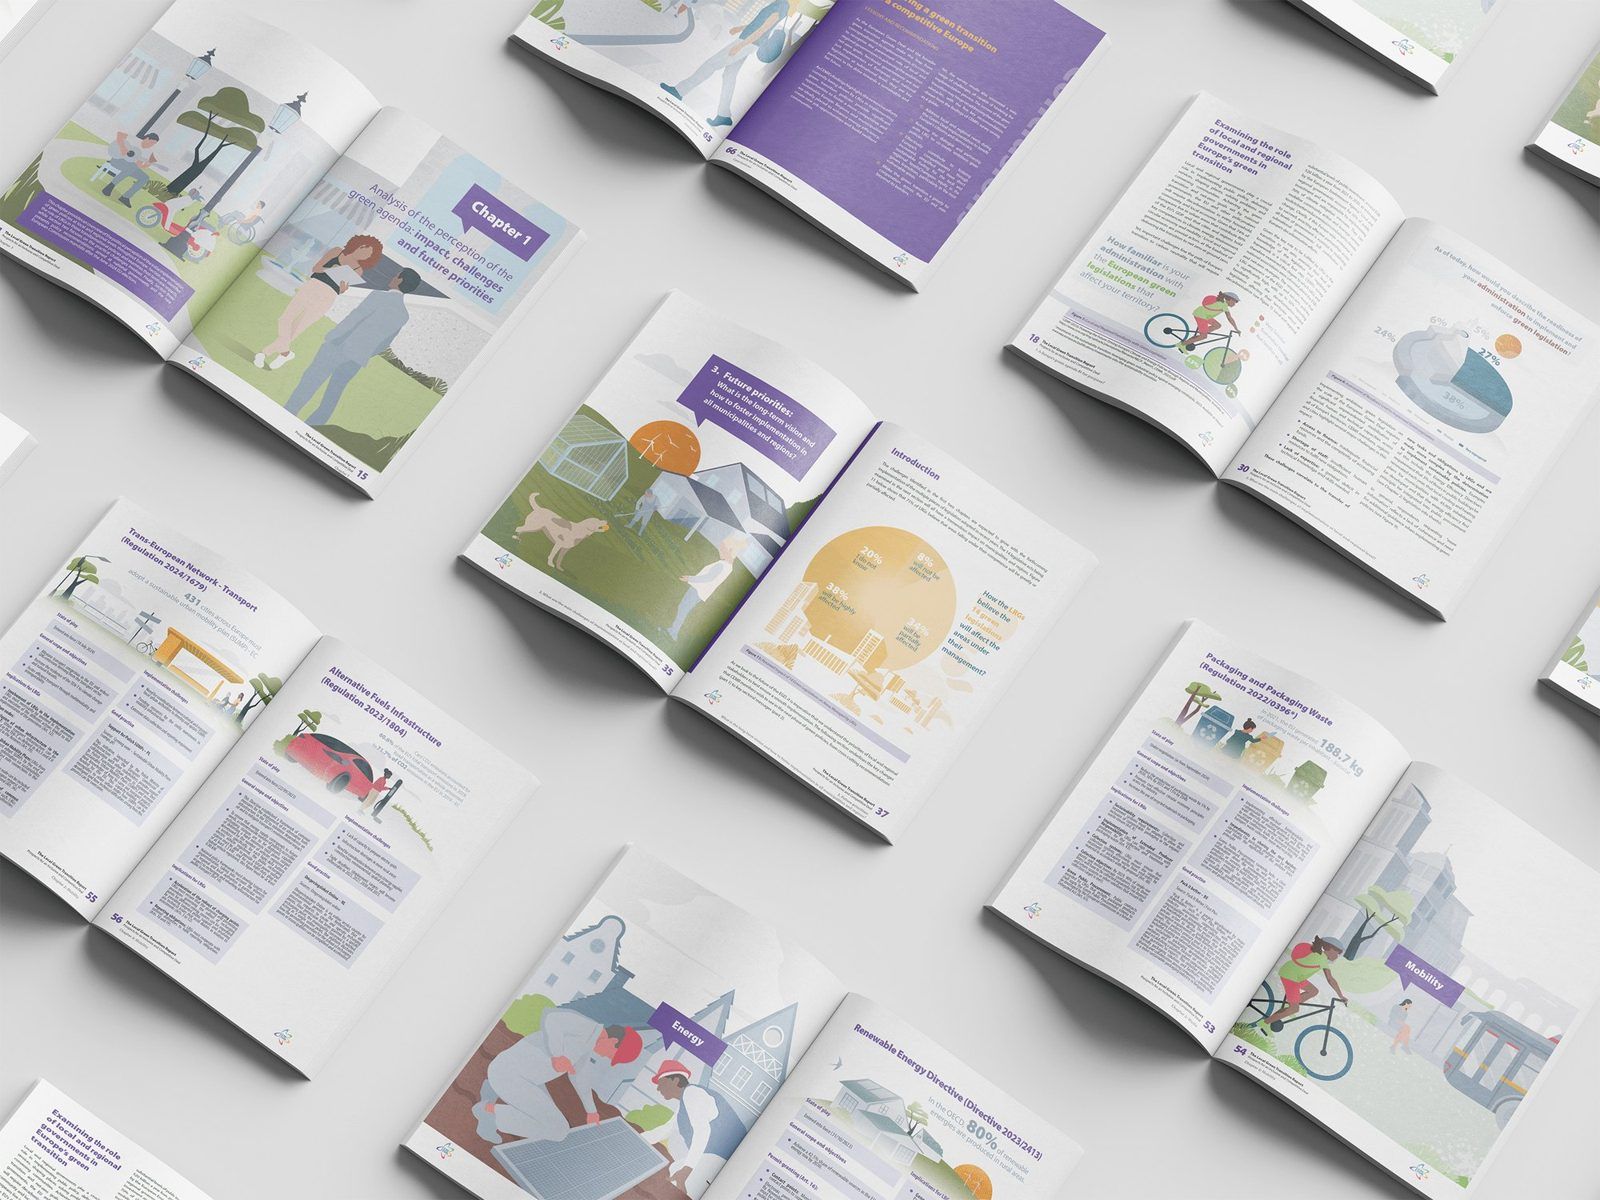
02We translated key themes into section-opening visuals, narrative vignettes, and infographics that prioritise clarity, pacing, and memorability.
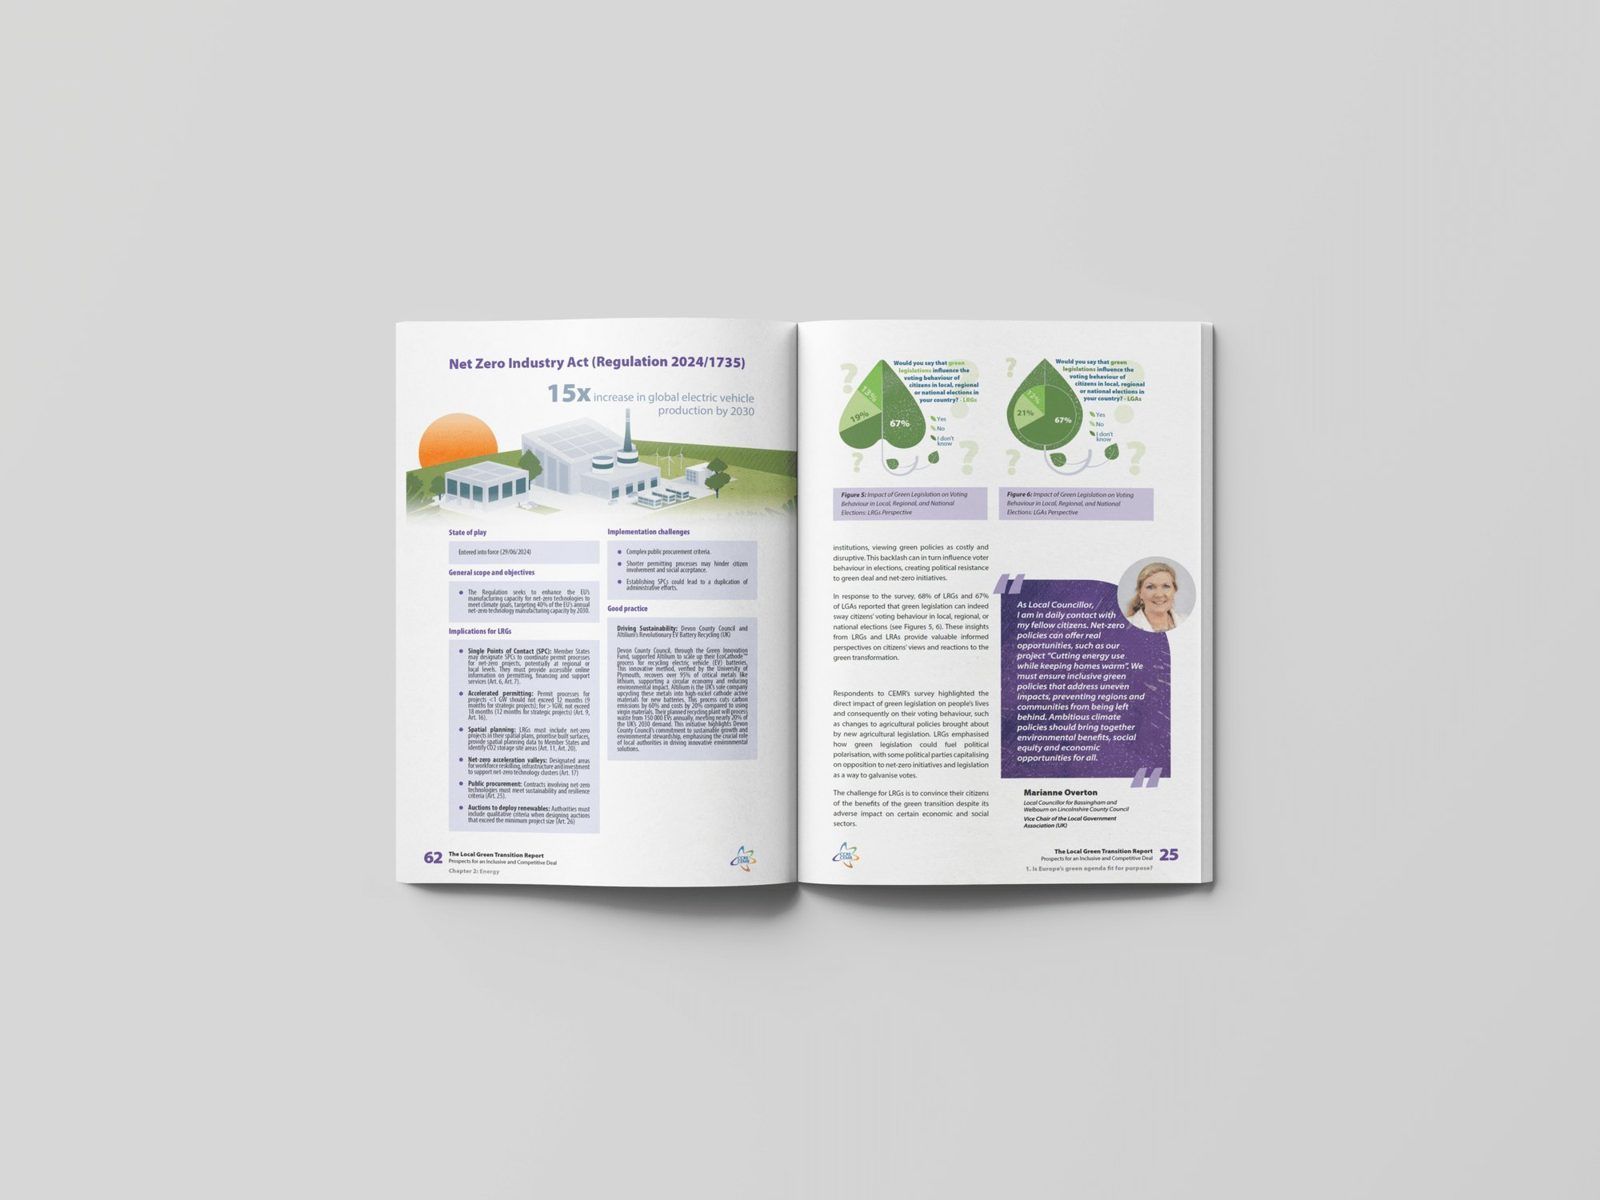
03We also designed repeatable layouts for the report’s “info sheets” and evidence blocks—so readers can move from context → implications → challenges → examples without friction—while maintaining a consistent visual rhythm throughout.
The report methodology is clearly documented (survey + working group input + desk research), ensuring the storytelling remains grounded in evidence.
Penrose
- Report design and layout
- Illustration
- Data visualisation
- Information design
Penrose team names to confirm.