
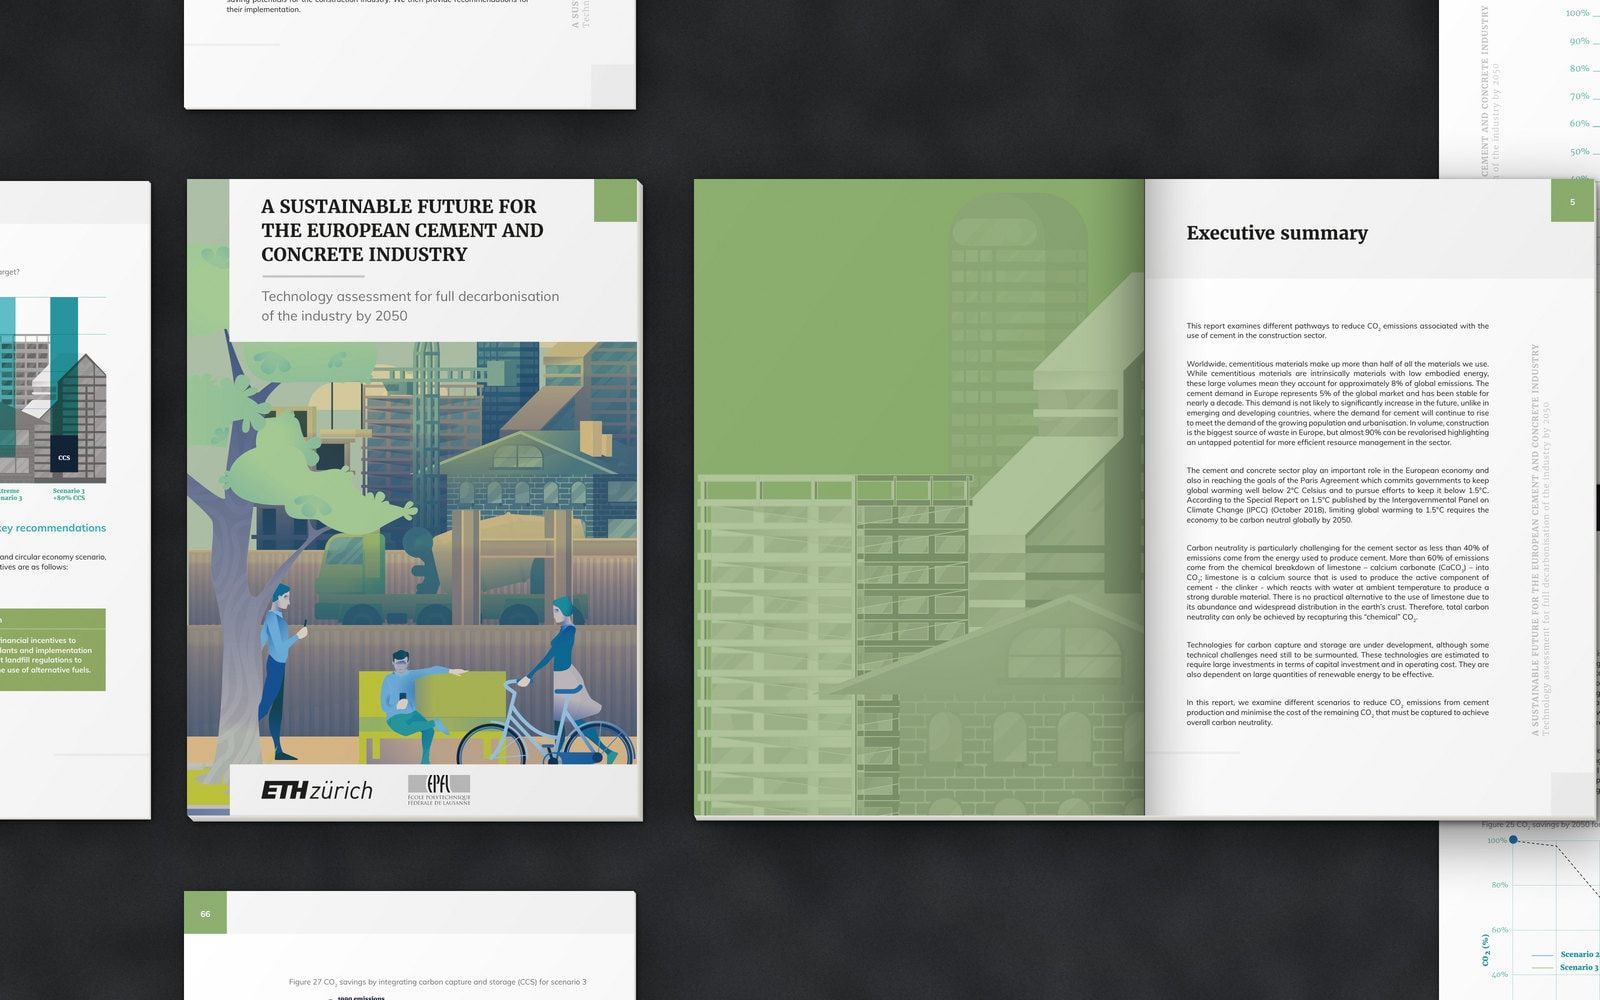
A 96-page technology assessment of how Europe’s cement and concrete industry could cut its CO₂ emissions by 2050. The report was written by researchers at ETH Zürich and EPFL and commissioned by the European Climate Foundation. We designed the publication: the cover and its illustration, the layout, the drawings of the construction value chain and the charts.
- ClientEuropean Climate Foundation
- WorkPublication design, layout, illustration and information graphics
- Year2018
The work

01The cover illustration.
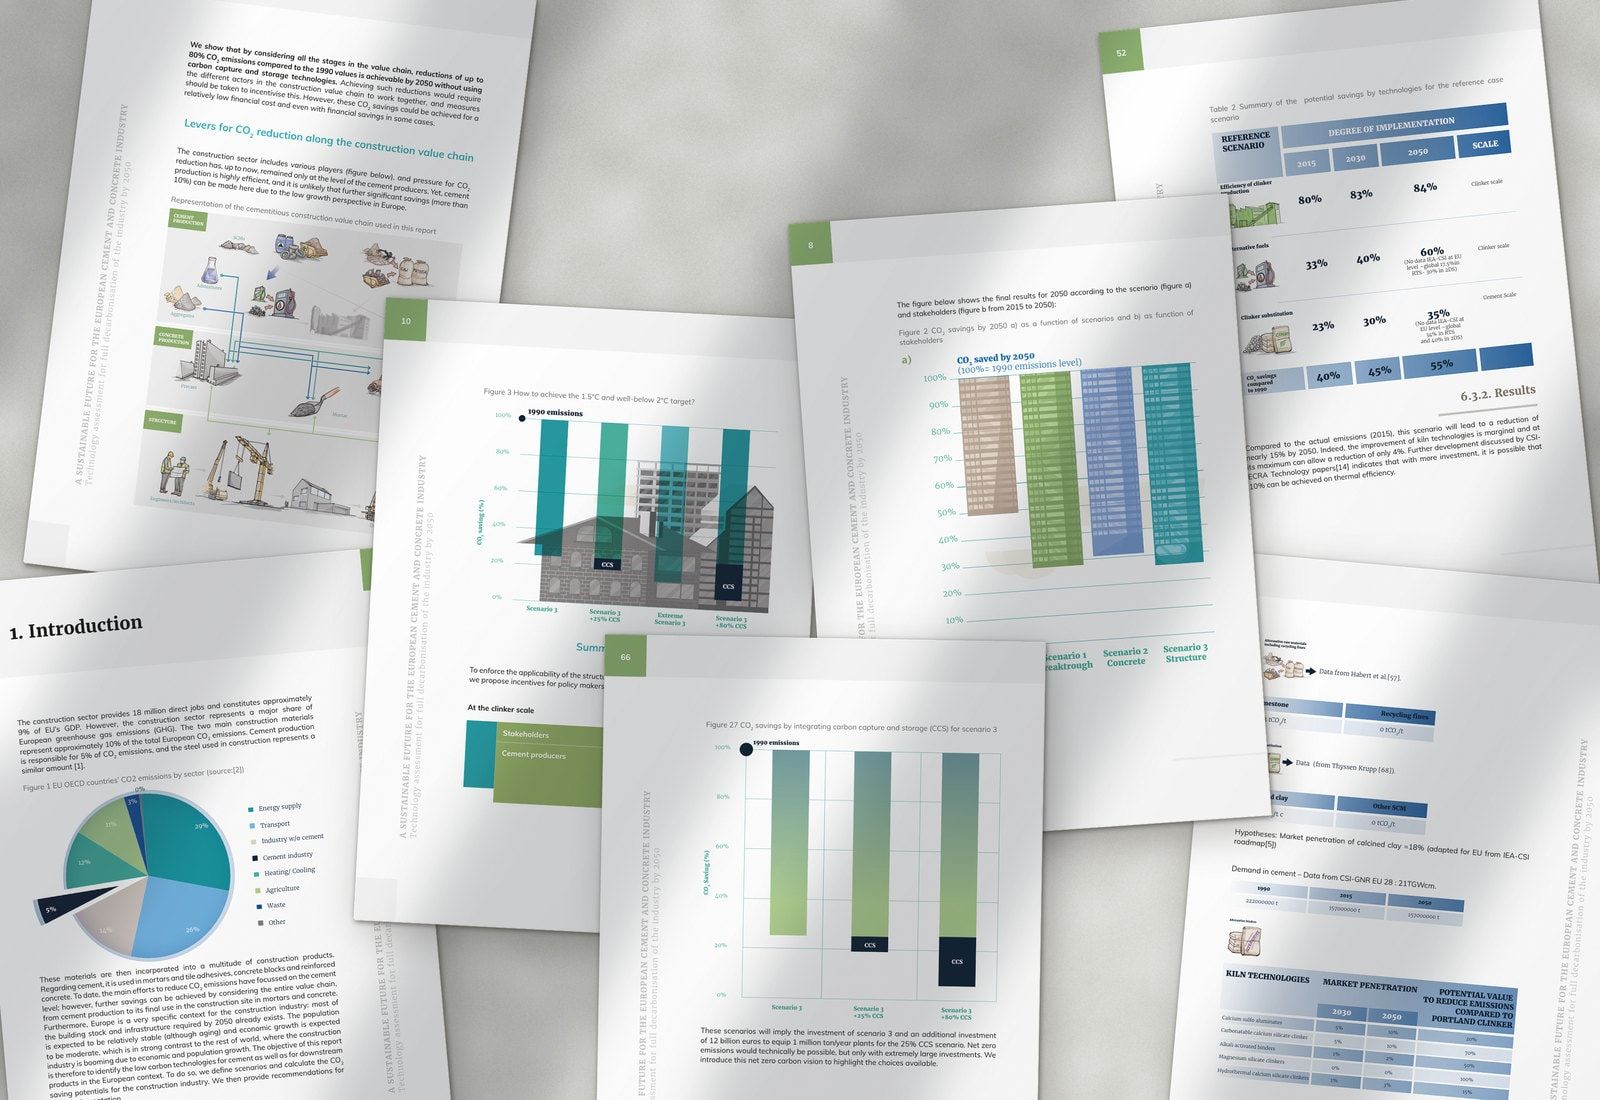
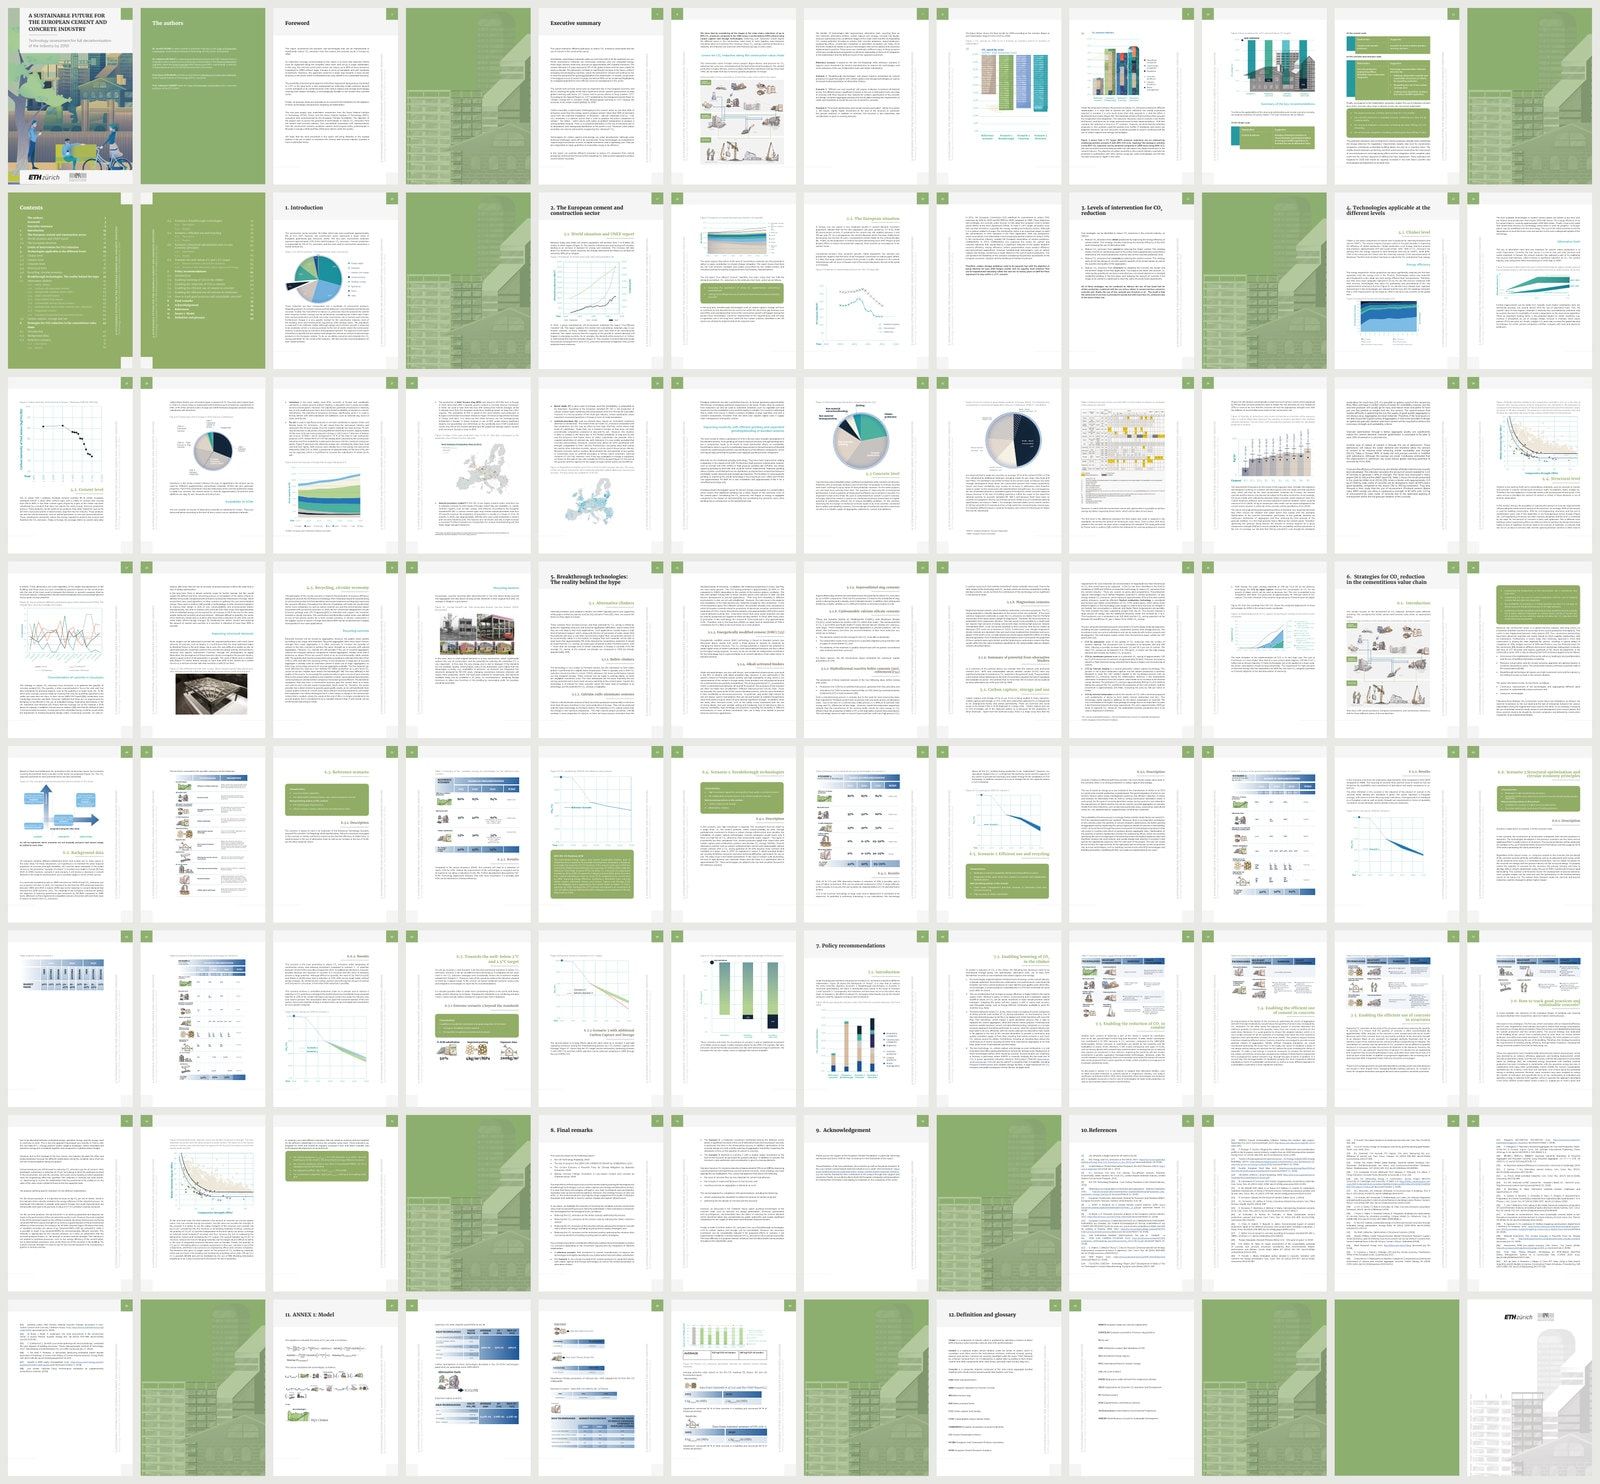
02Charts, tables and drawings from across the report.
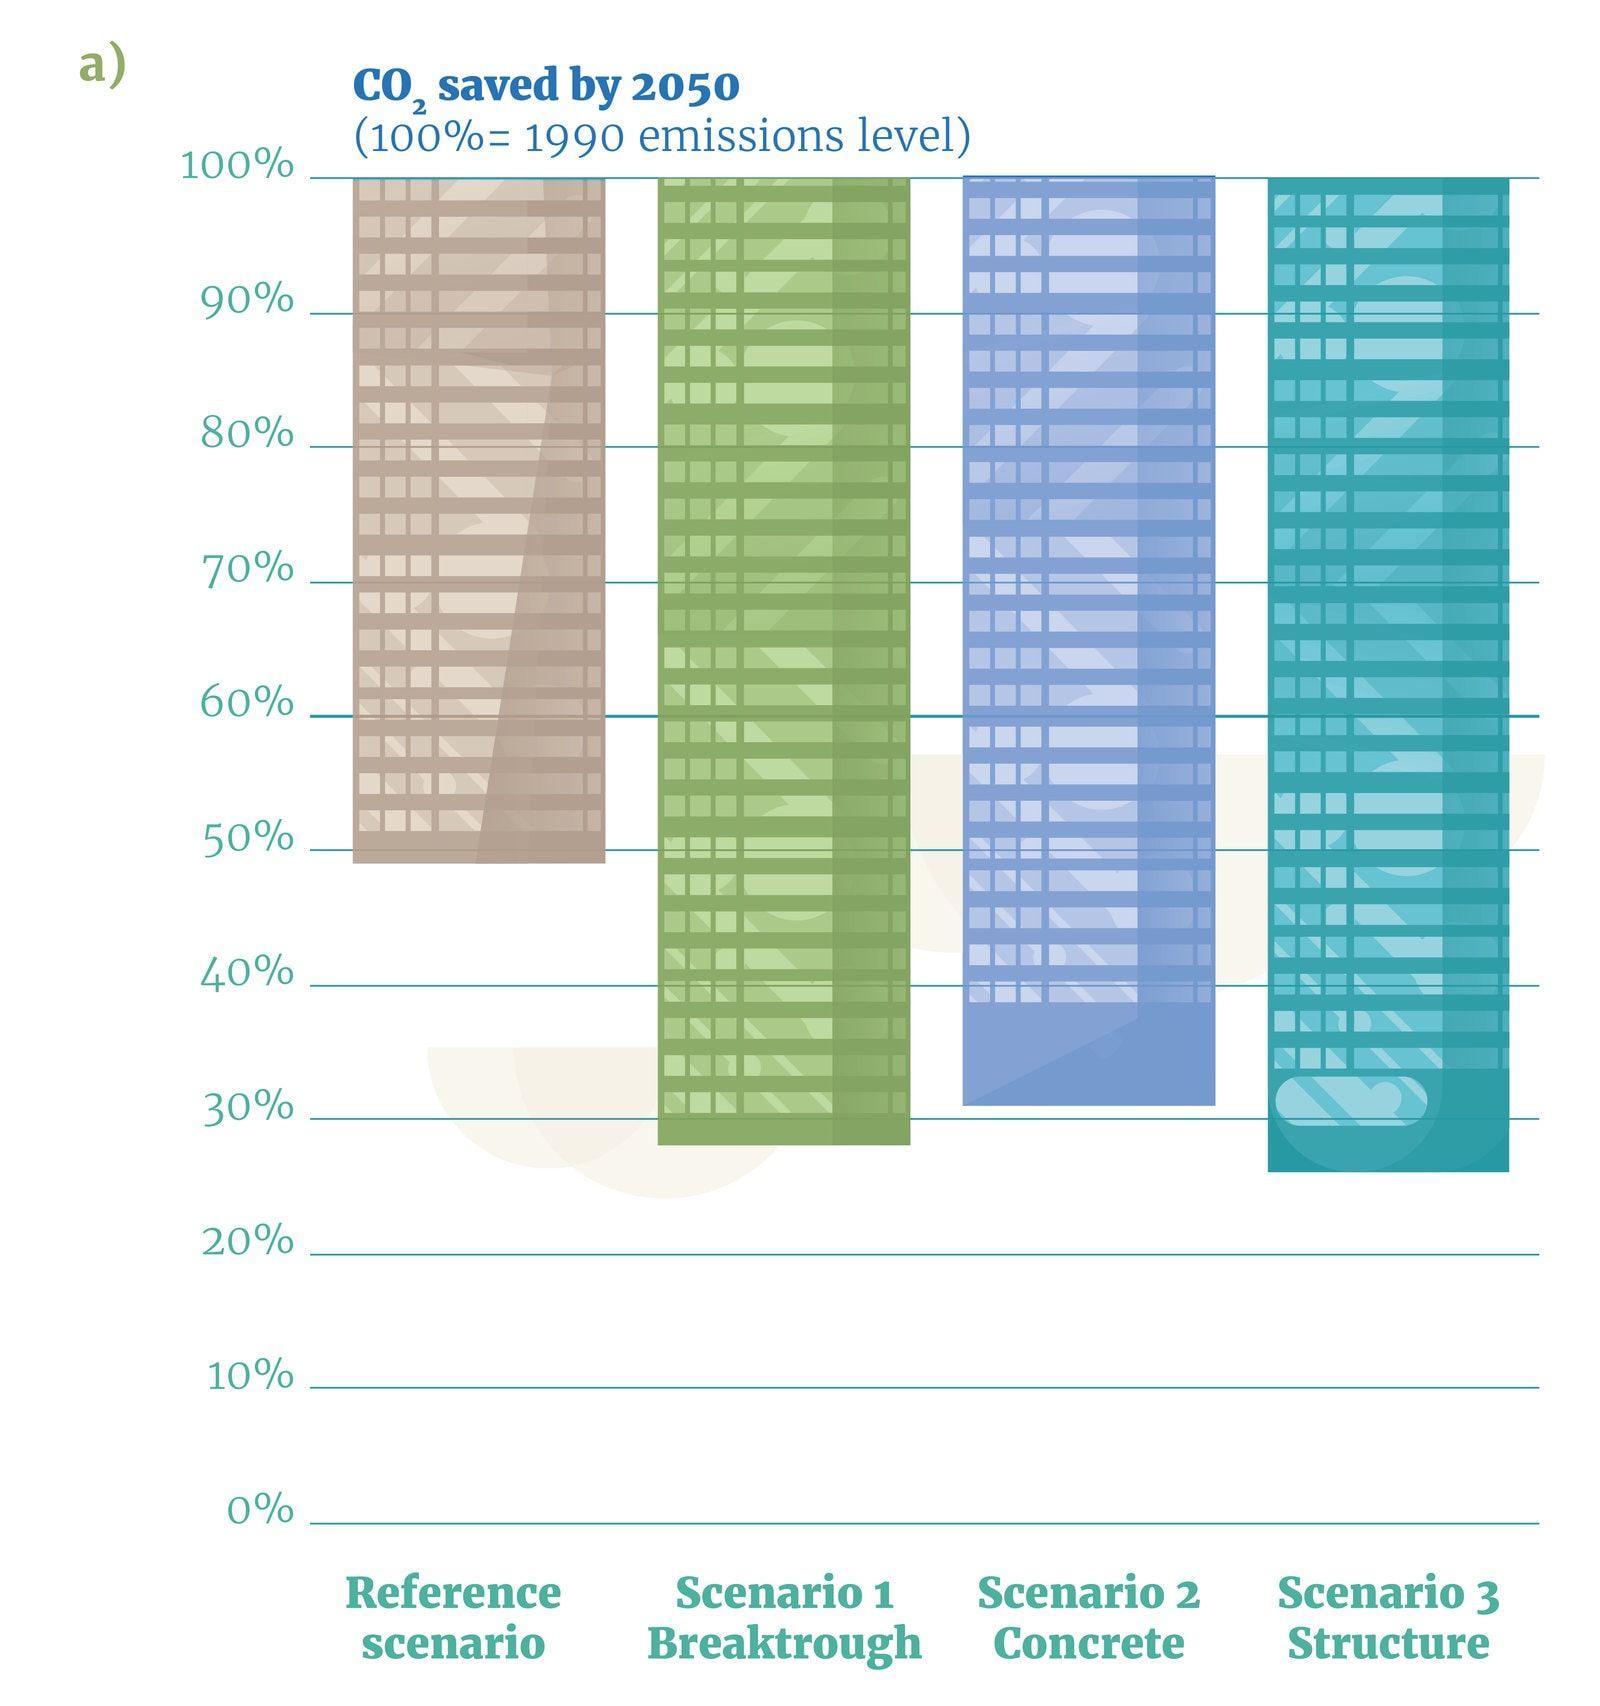
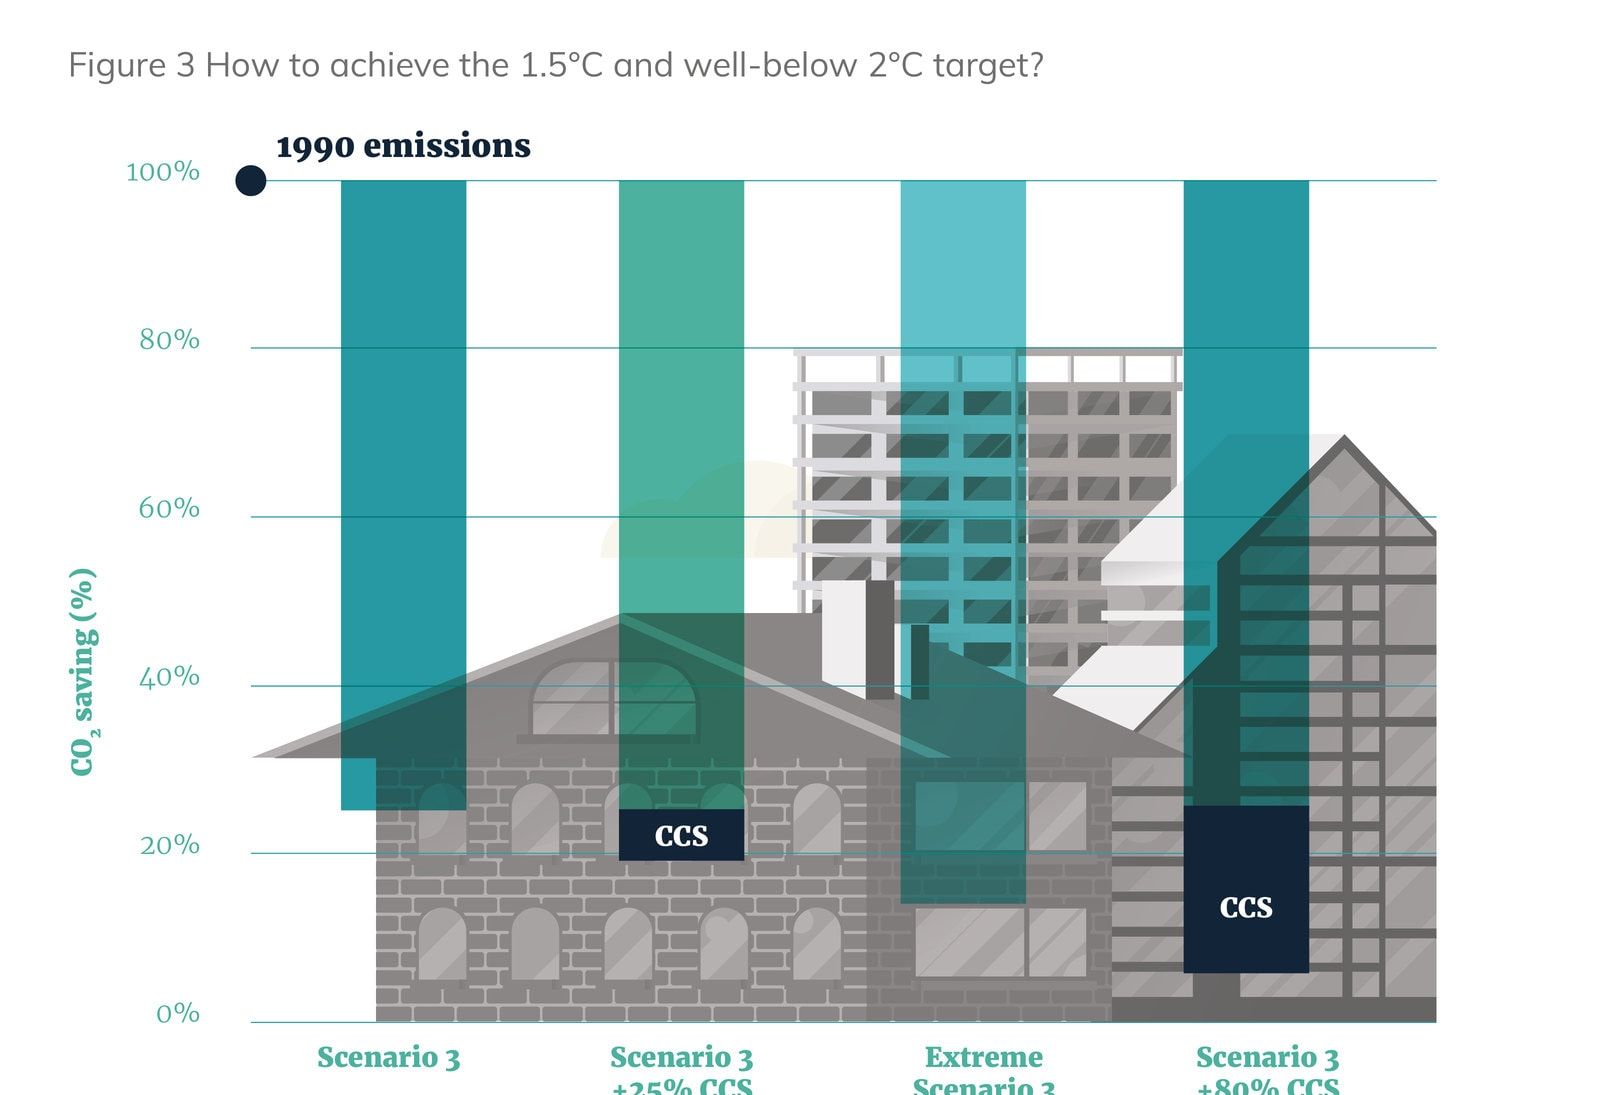
03The figures of a report about concrete, drawn as buildings.
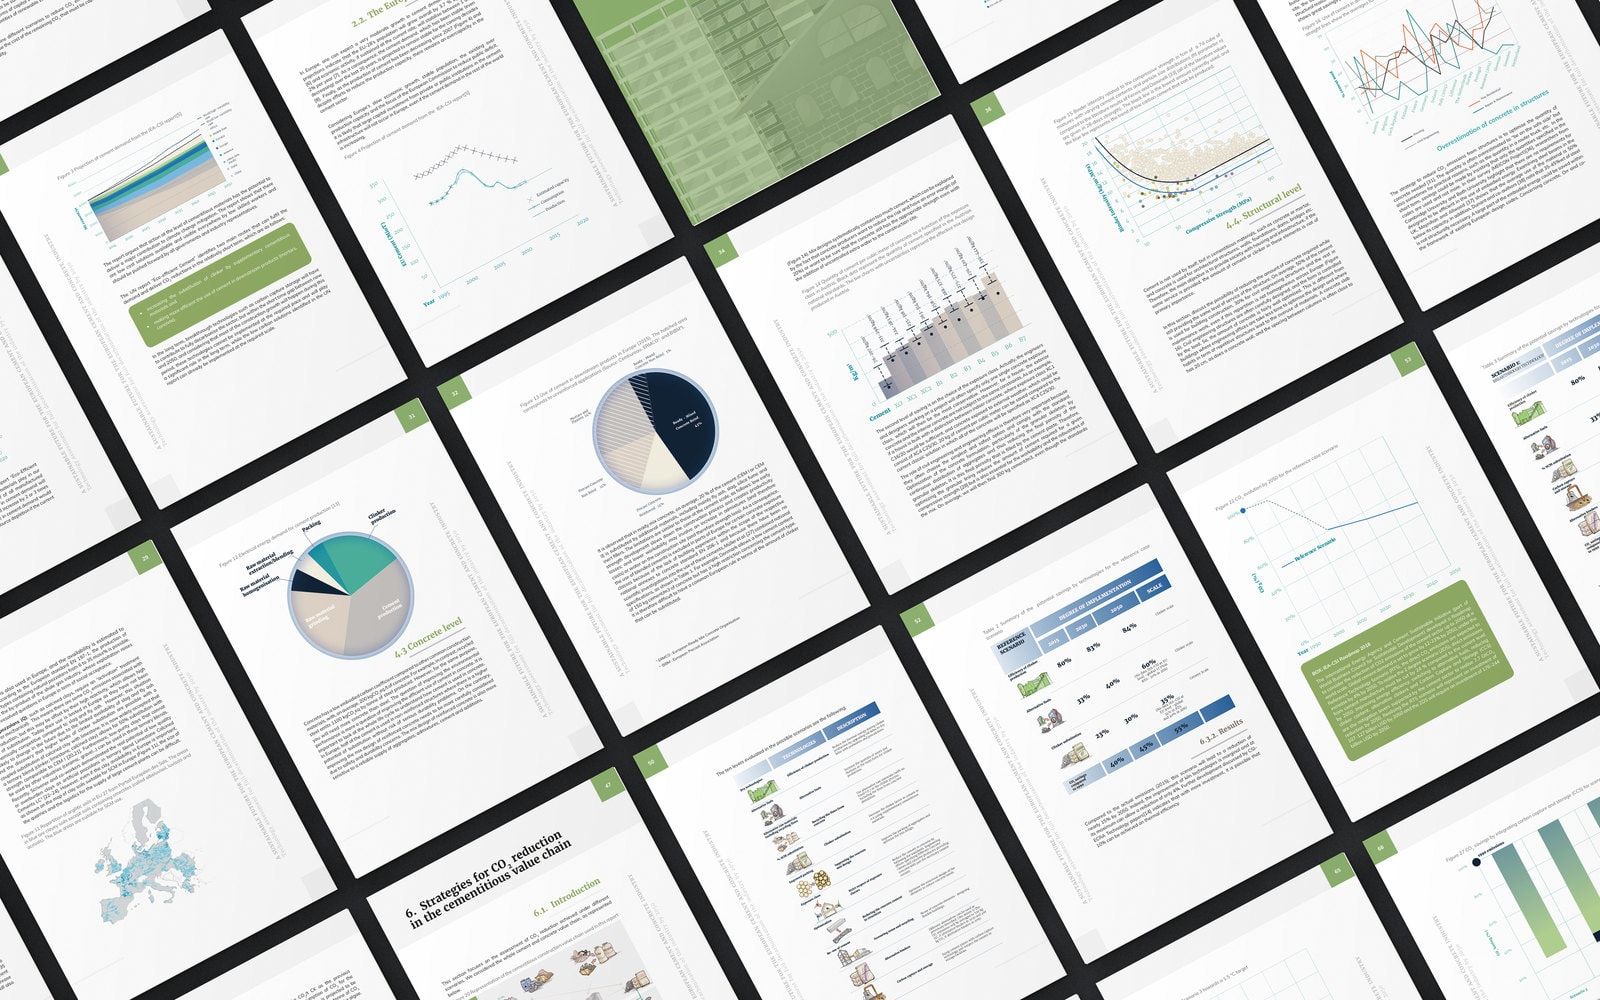
04One system across 96 pages.
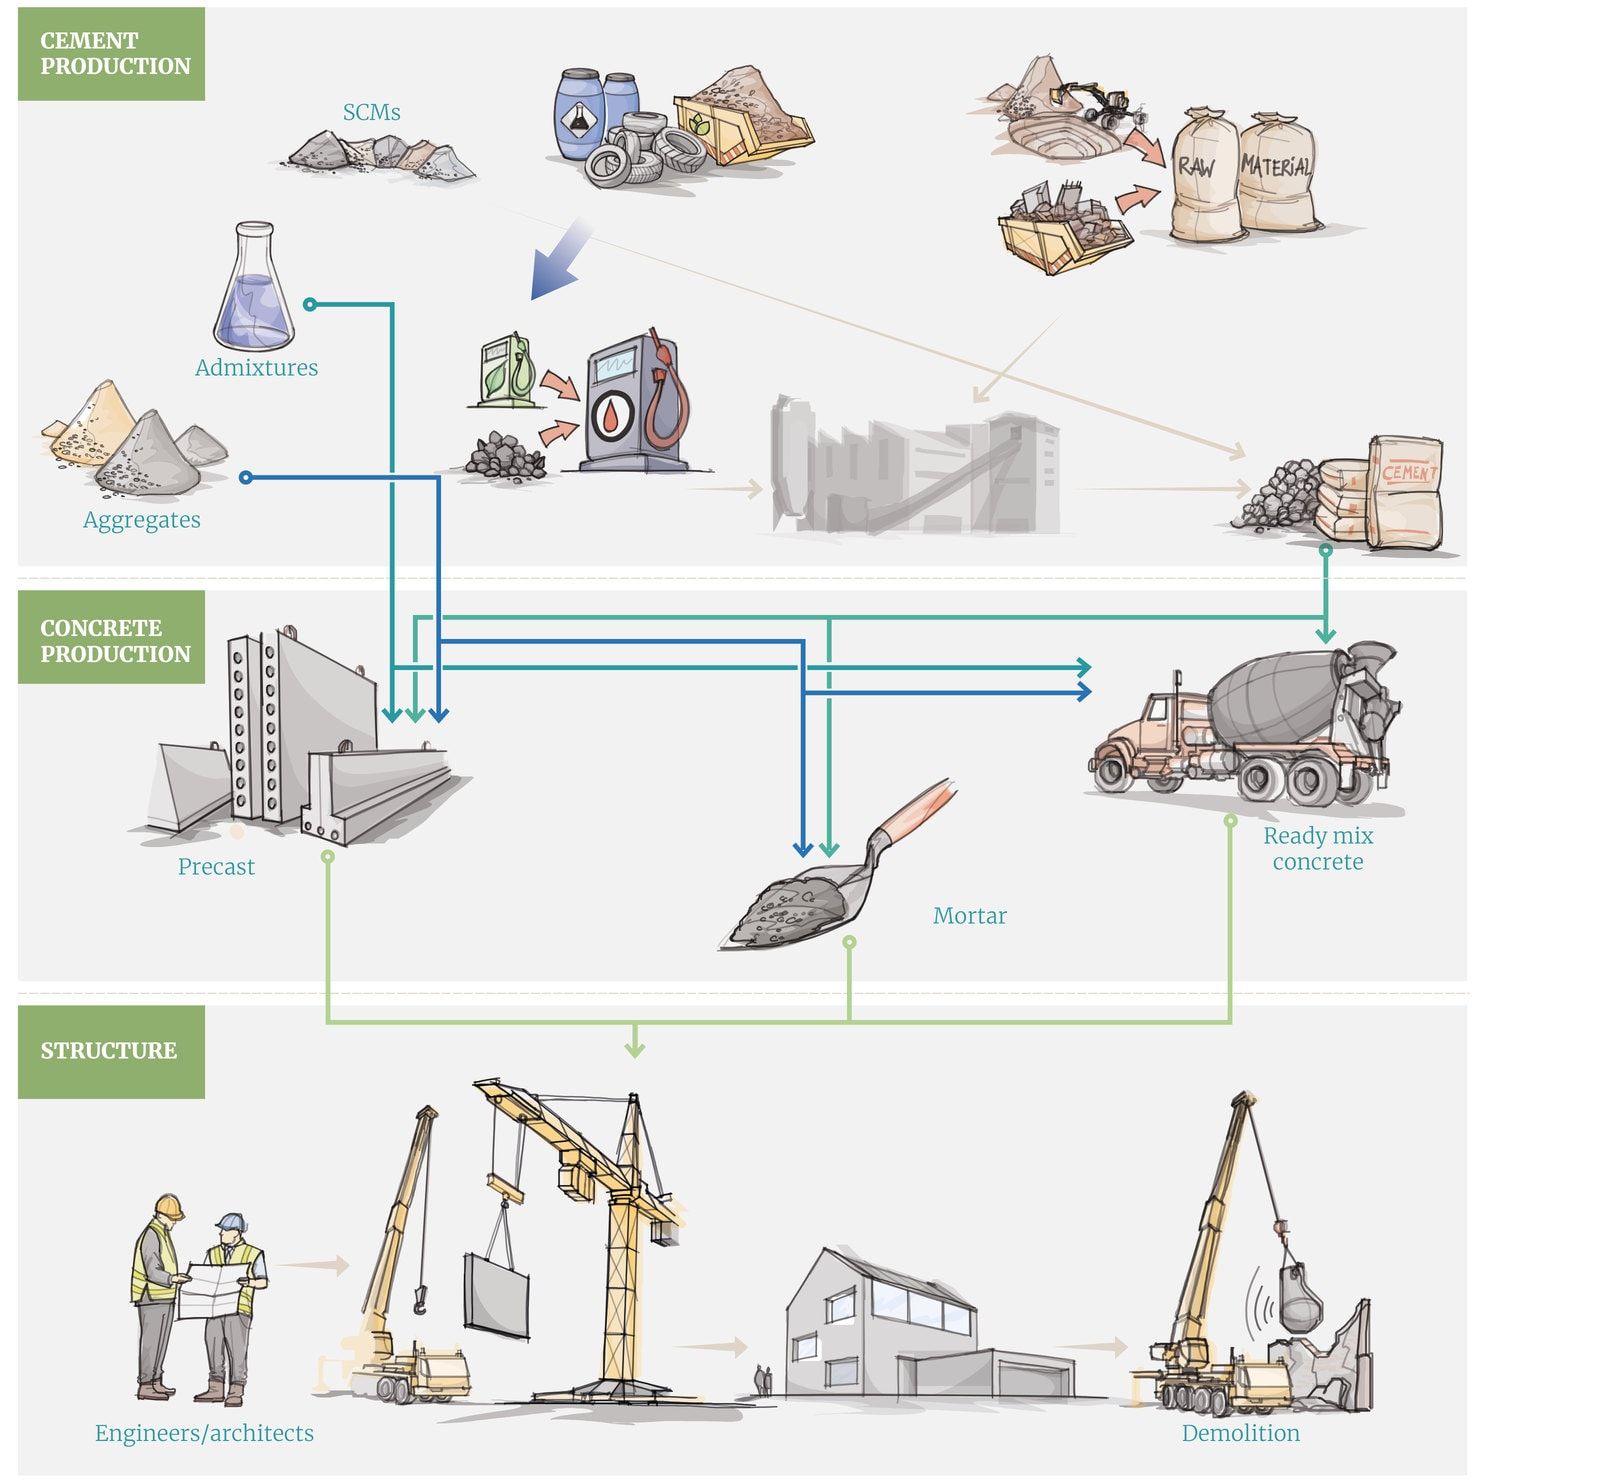
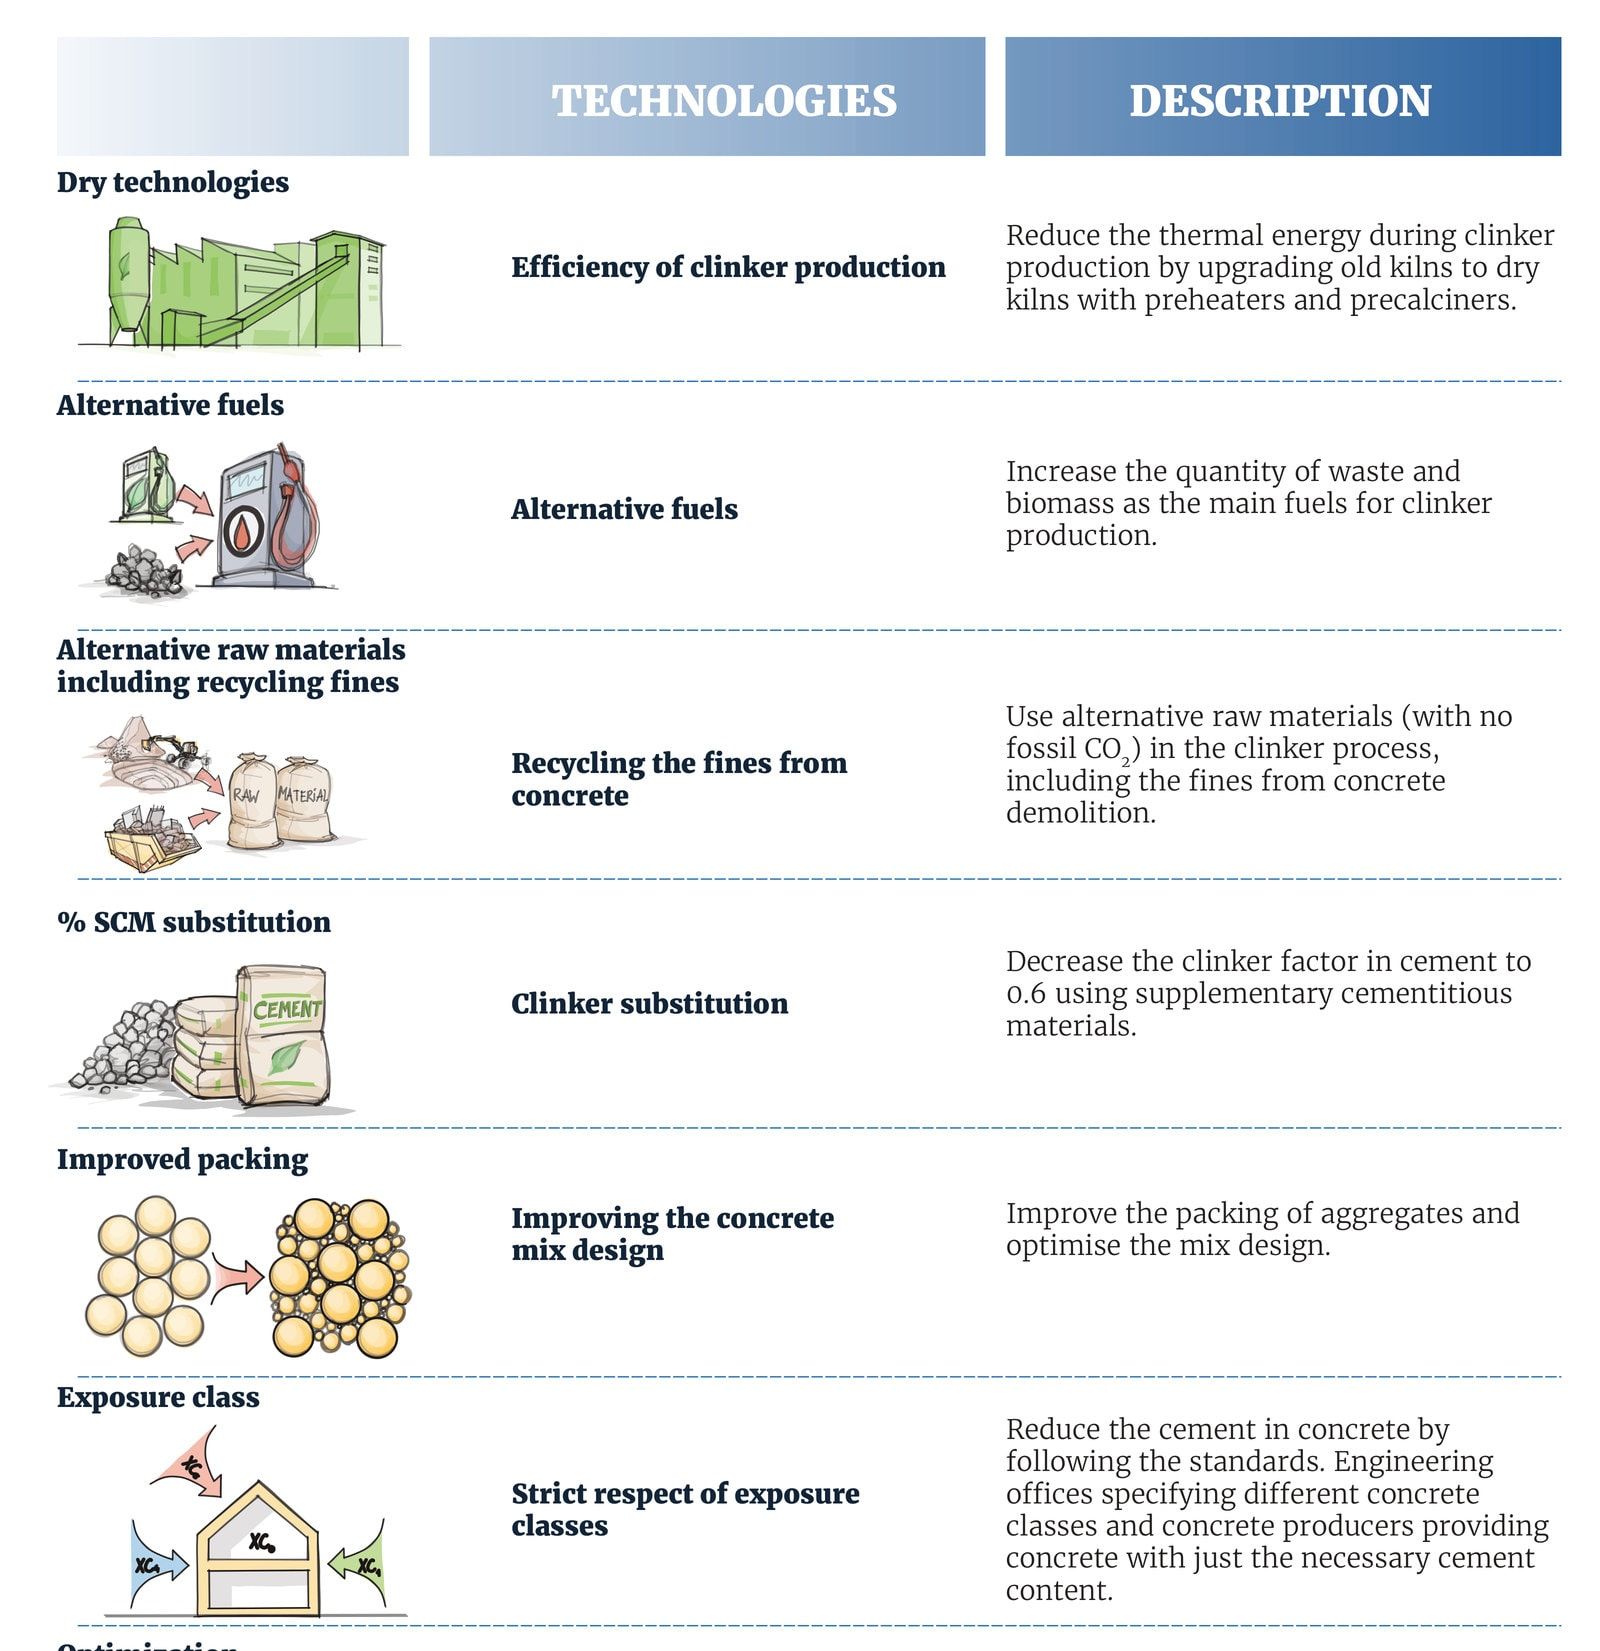
05The value chain, and its drawings reused as icons for each lever.
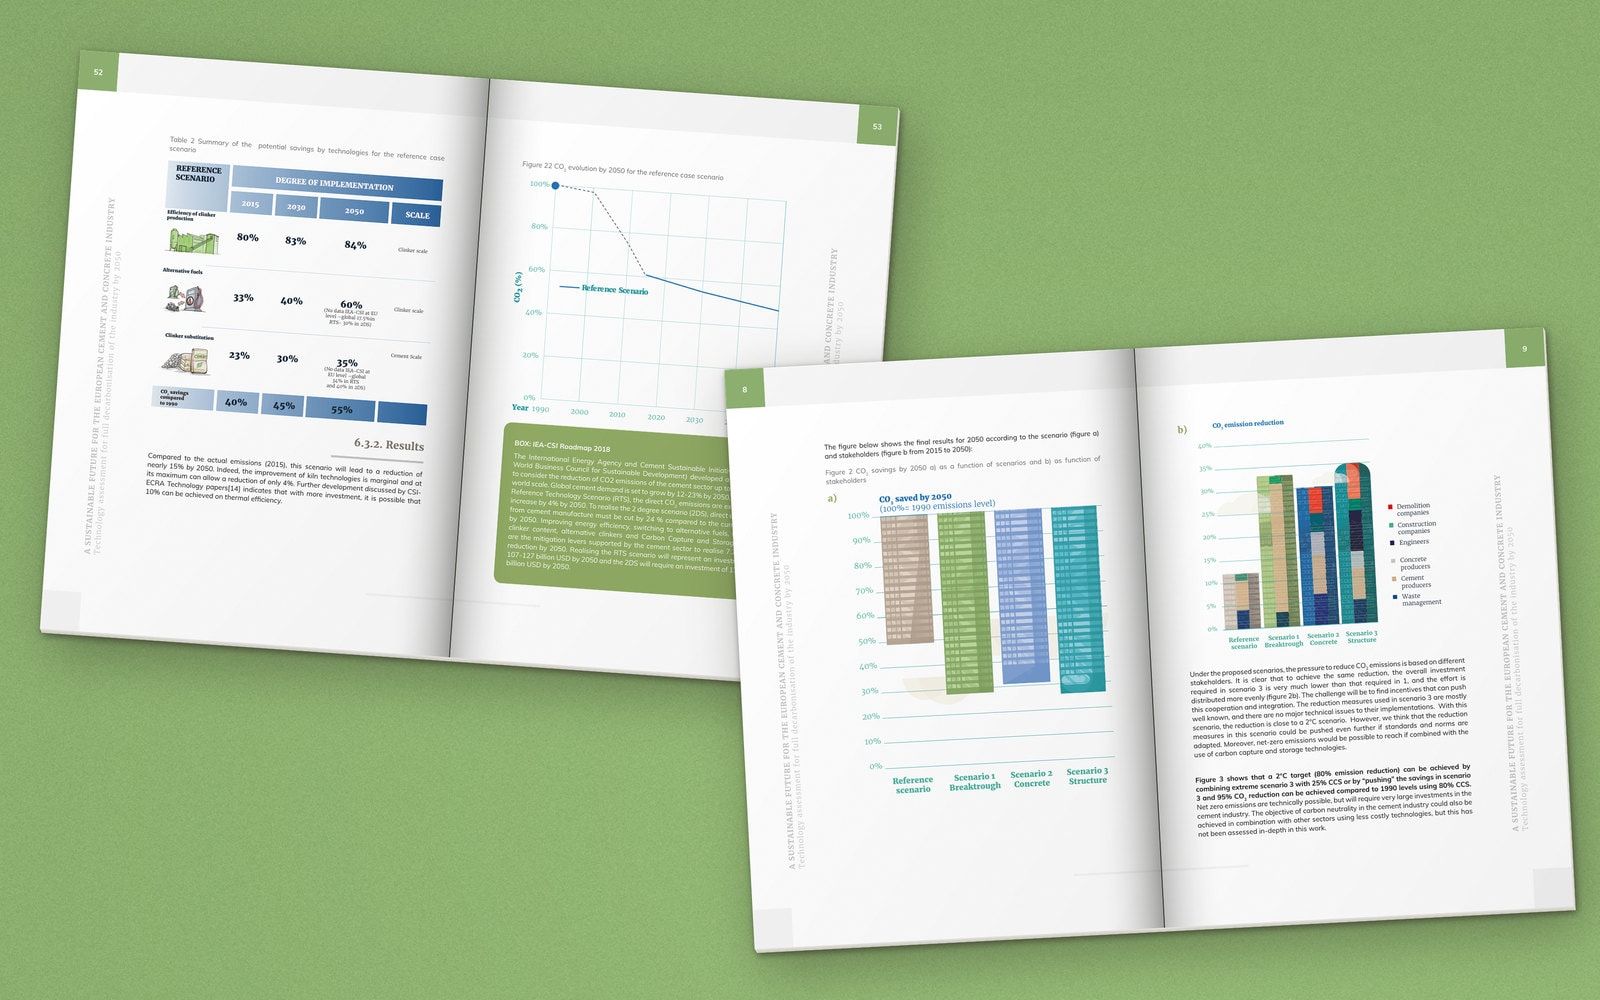
06A scenario table with its chart, and the summary of results.
A report about concrete can show its figures as buildings.
How we got there
In this case study
The report
Cement-based materials make up more than half of all the materials we use, and account for about 8% of global CO₂ emissions. The report examines how the European industry could reduce its share by 2050.
Its central message is about who has to act. Pressure to cut emissions had stayed with cement producers. The authors show that reductions of up to 80% compared with 1990 are achievable without carbon capture, provided everyone along the value chain takes part: concrete producers, engineers and architects, construction and demolition companies.
The results were verified in two consultation workshops in Brussels, with representatives of the construction industry, academic experts and European policy professionals.
A value chain you can see
The argument depends on the reader understanding who does what between raw materials and a finished building. We drew the value chain as one picture in three stages: cement production, concrete production and the structure, through to demolition.
The same drawings return through the report as icons. Each of the ten levers assessed, from the efficiency of clinker production to carbon capture and storage, carries its own small drawing in the scenario tables. A reader can follow a technology from the overview to its numbers.
Charts built from buildings
A report about concrete can show its figures as buildings. In the summary of results, the bar for each scenario is drawn as a tower block. In the chart that sets the savings against the 1.5°C and well-below 2°C targets, a factory and housing stand behind the bars.
The scenario charts that follow are plainer. They share one grid and one set of colours, so the reference scenario and the three alternatives can be compared from page to page.
One system for 96 pages
The cover sets the tone: three people on a street, with a construction site and the city behind them. Green divider pages carry a drawing of buildings between the chapters.
Text pages keep a single column, with the report’s title running up the outer margin. Tables, policy summaries and highlighted boxes use the same greens and blues as the charts, so the technical sections read as part of the same publication.
Penrose
 Andrei CotruțIllustration and layout design