
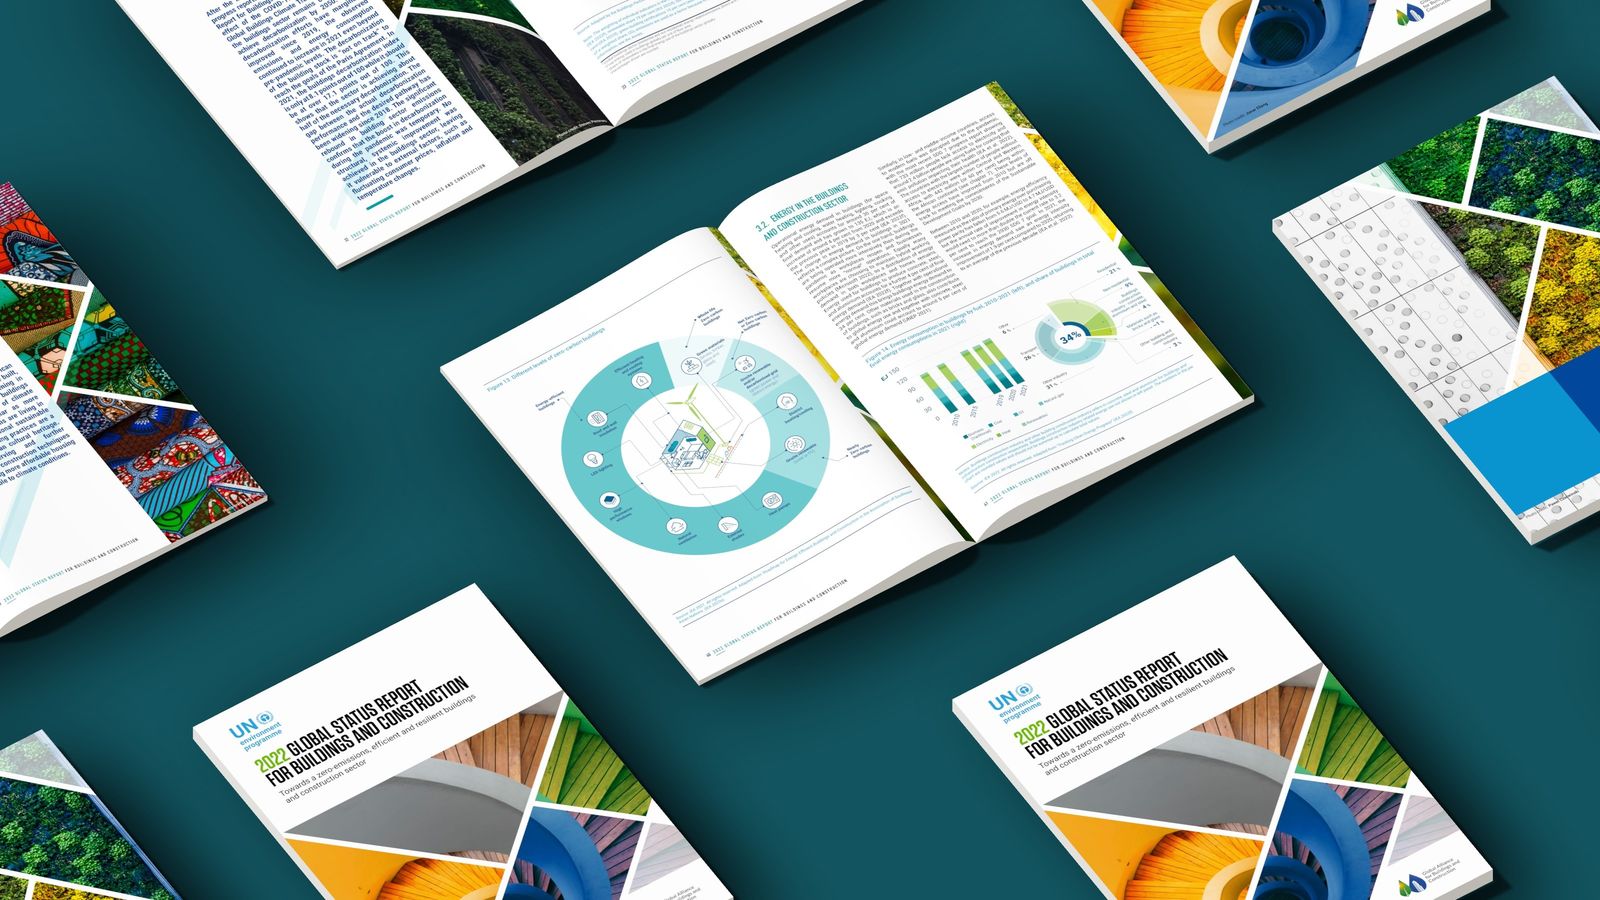
The visual concept, infographics and layout of the 2022 Global Status Report for Buildings and Construction, the annual reference on the sector's progress towards zero emissions.
- ClientUnited Nations Environment Programme
- WorkCover and visual concept, infographics, layout
- Timeframe2022
- StatusPublished
The work
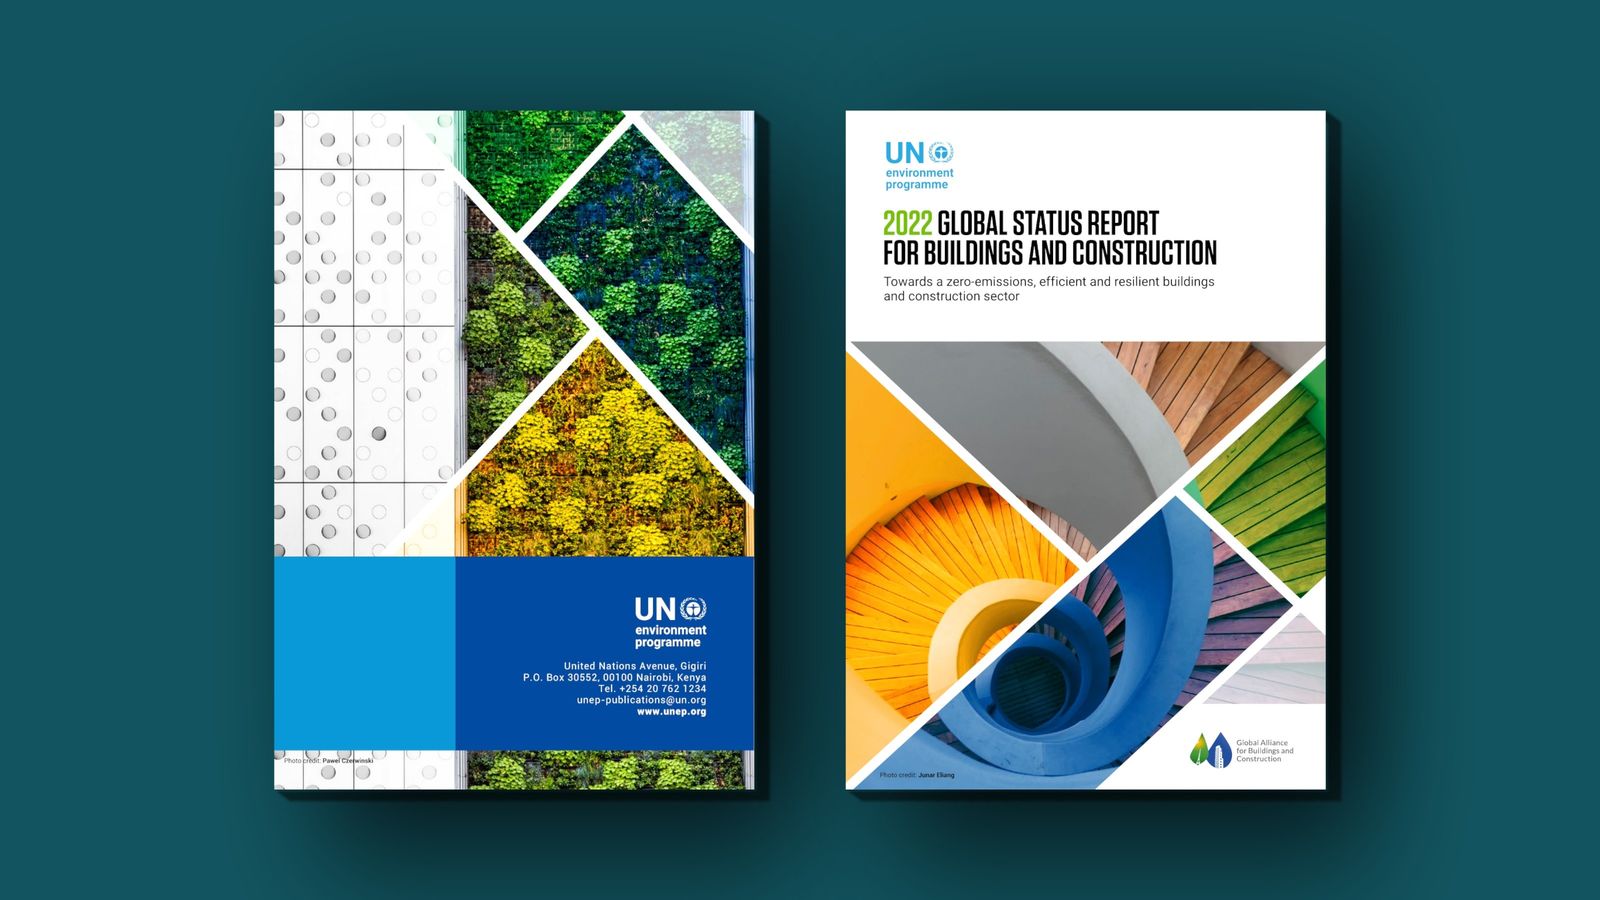
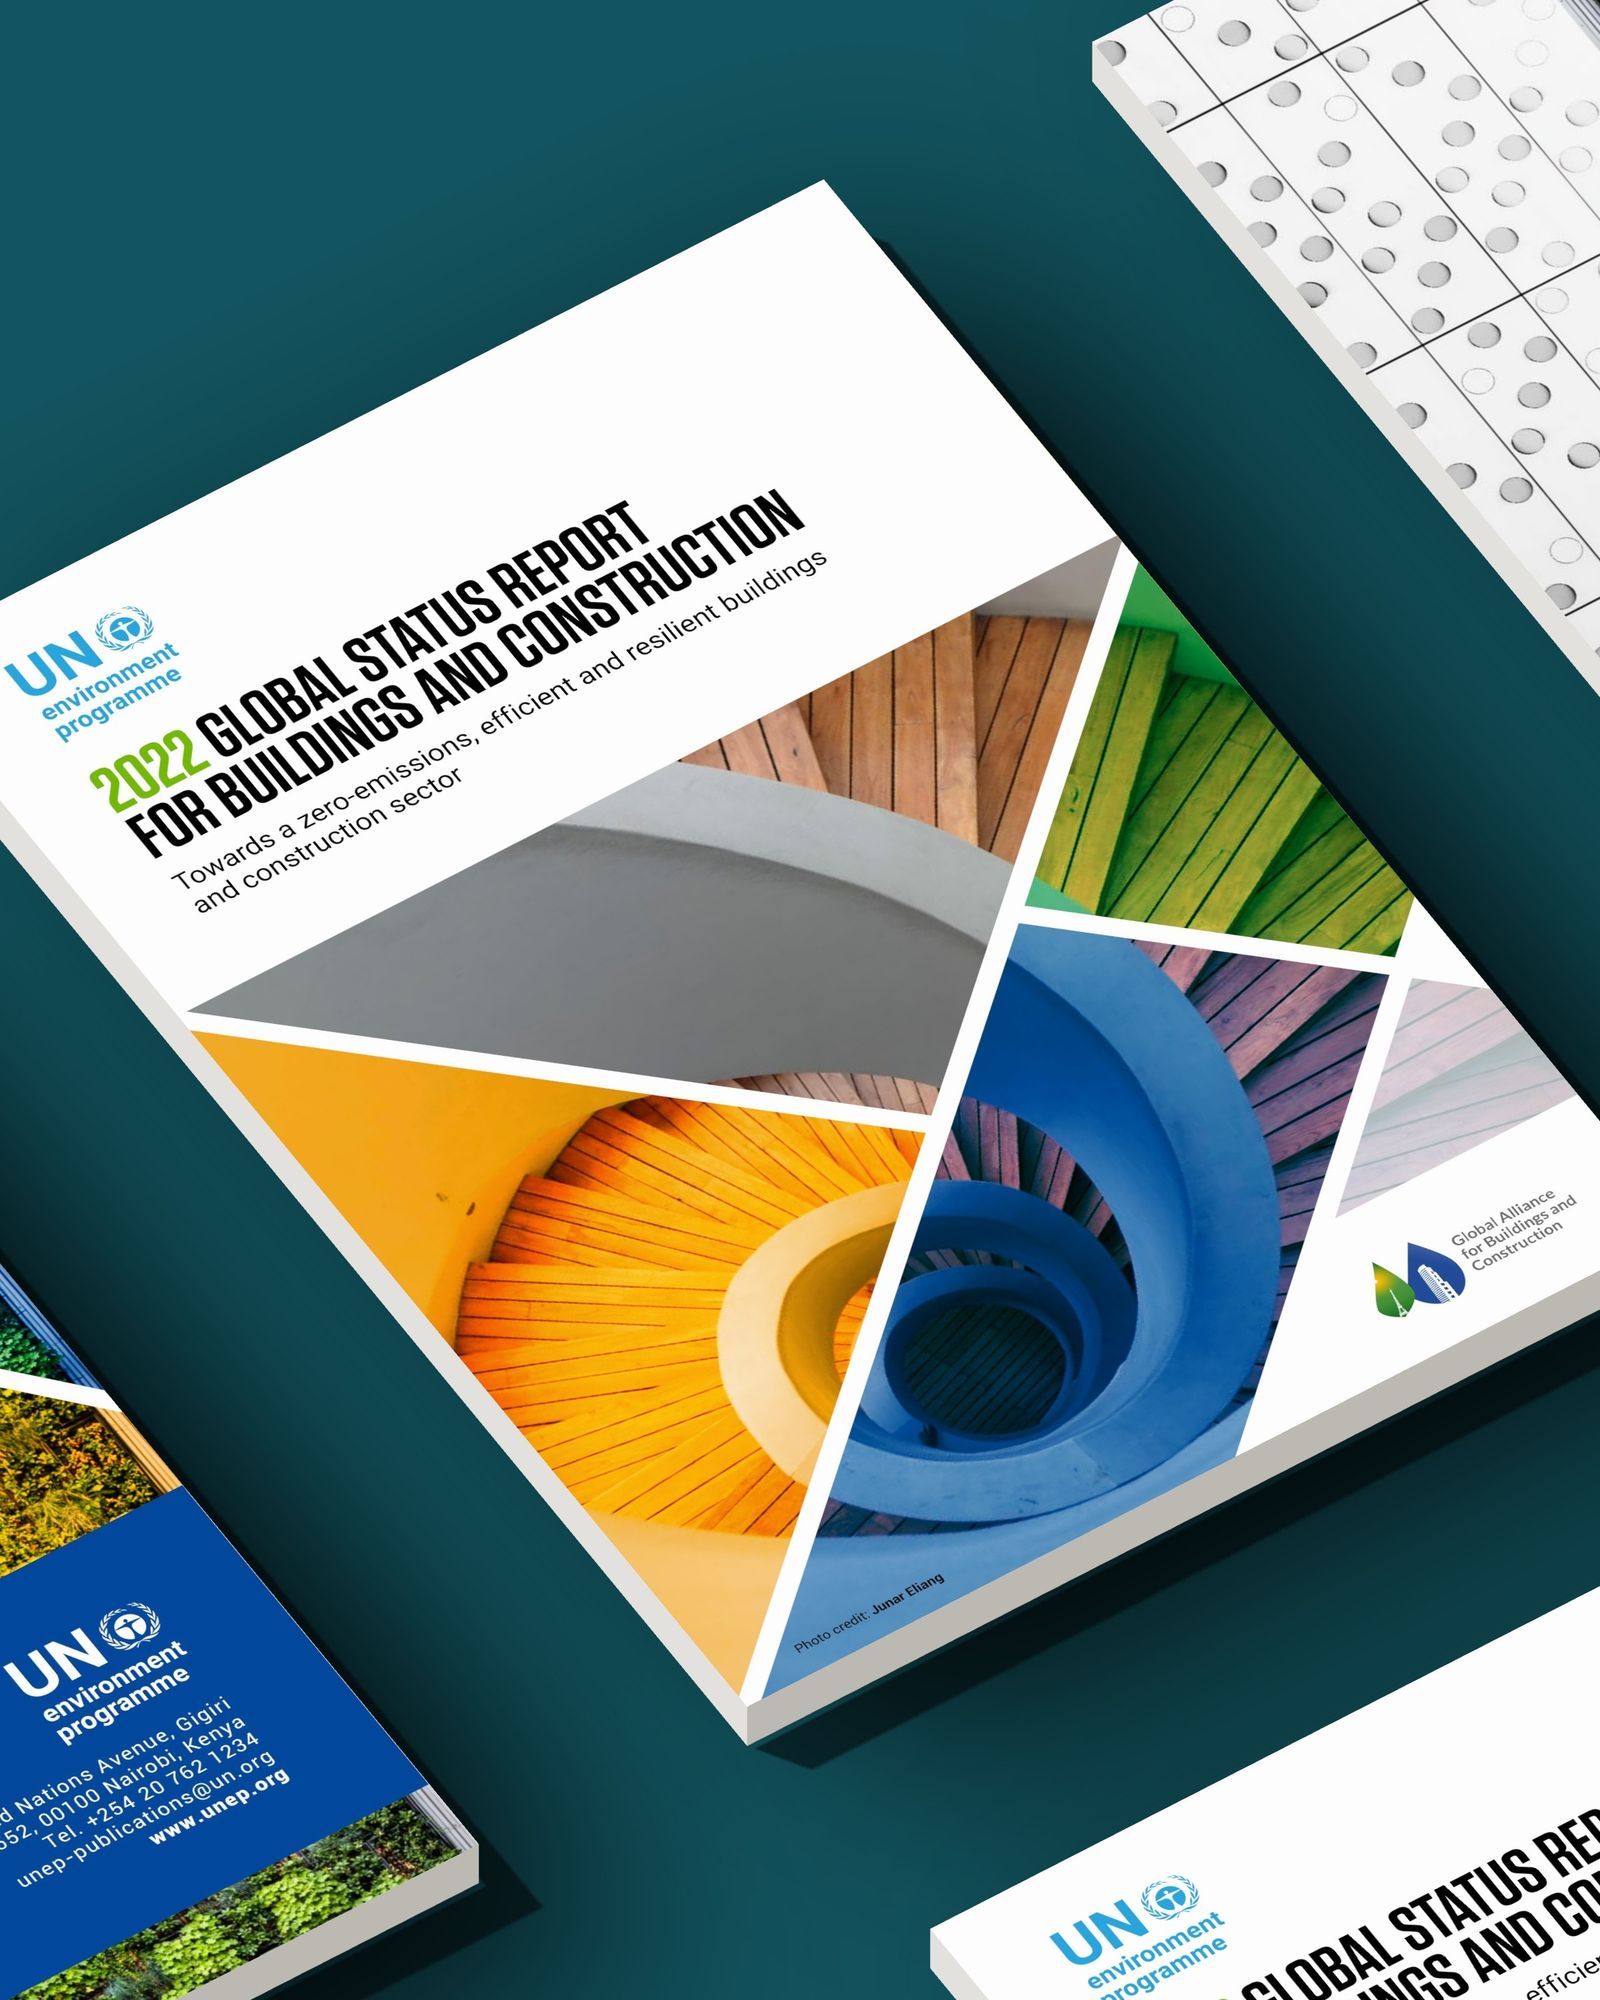
01The back and front covers.
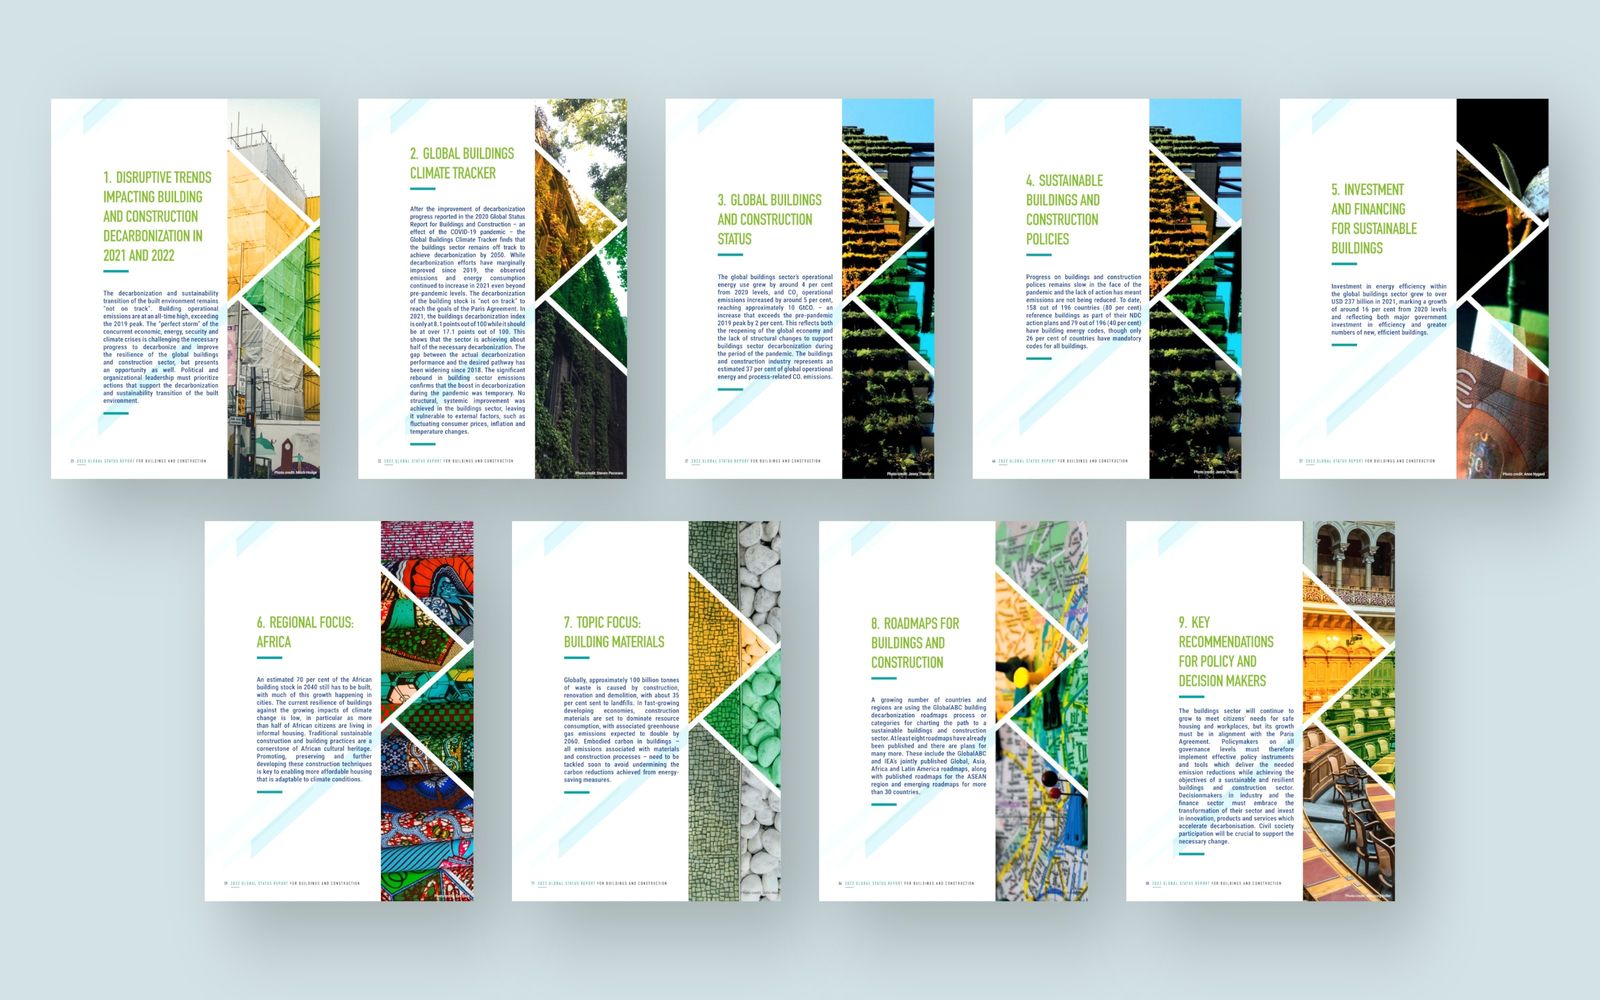
02Nine chapters, each opened by the same diagonal cut.
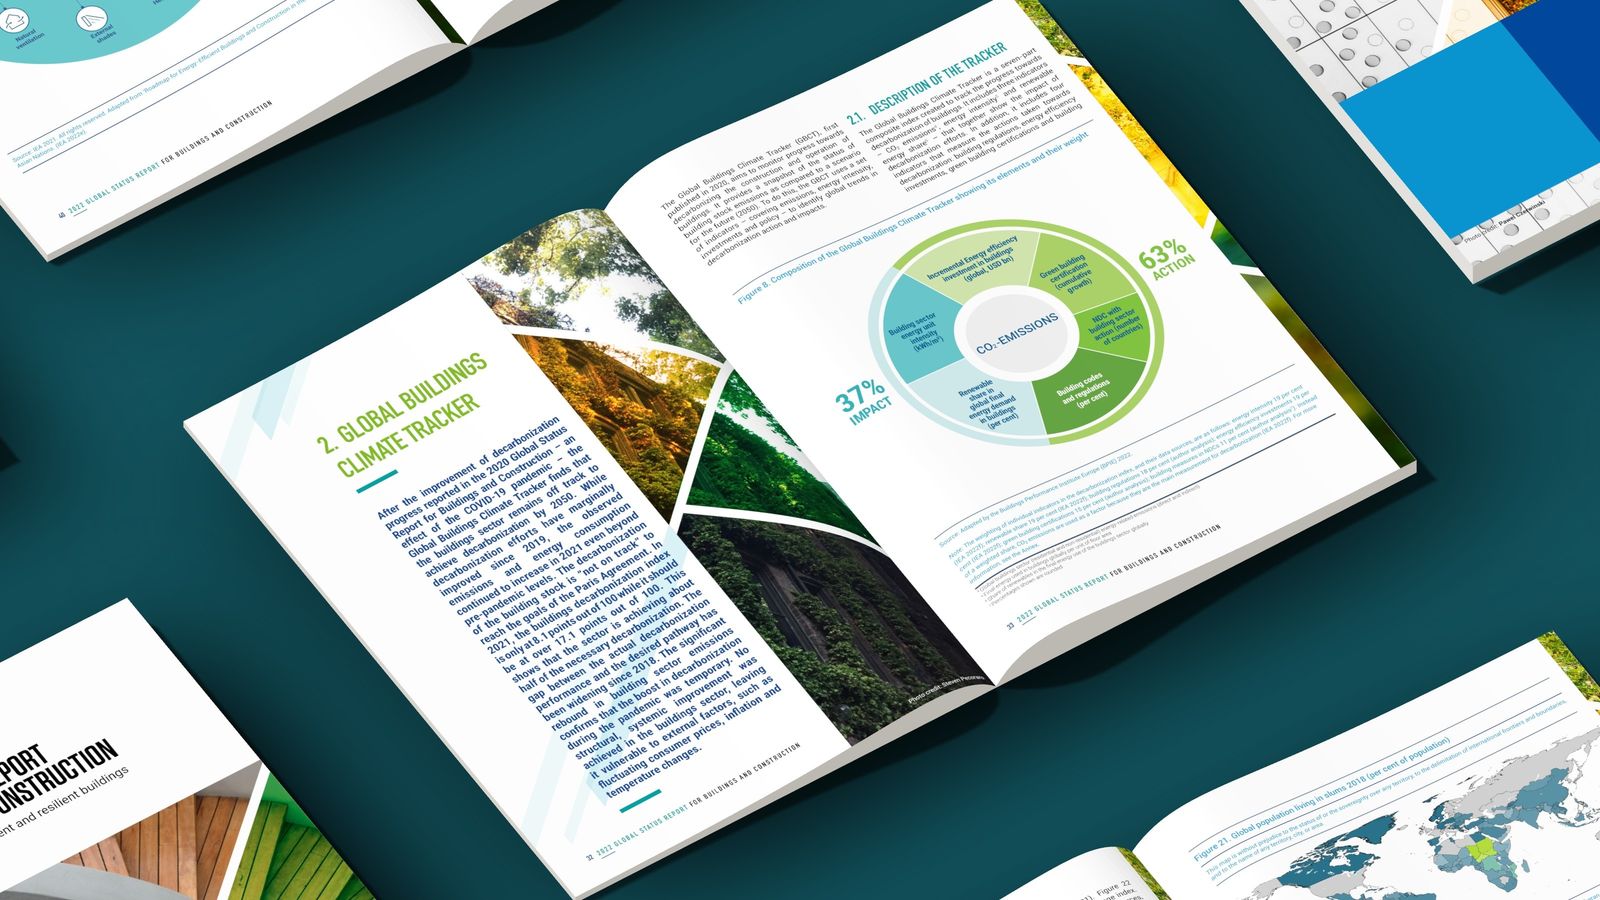
03The Global Buildings Climate Tracker chapter.
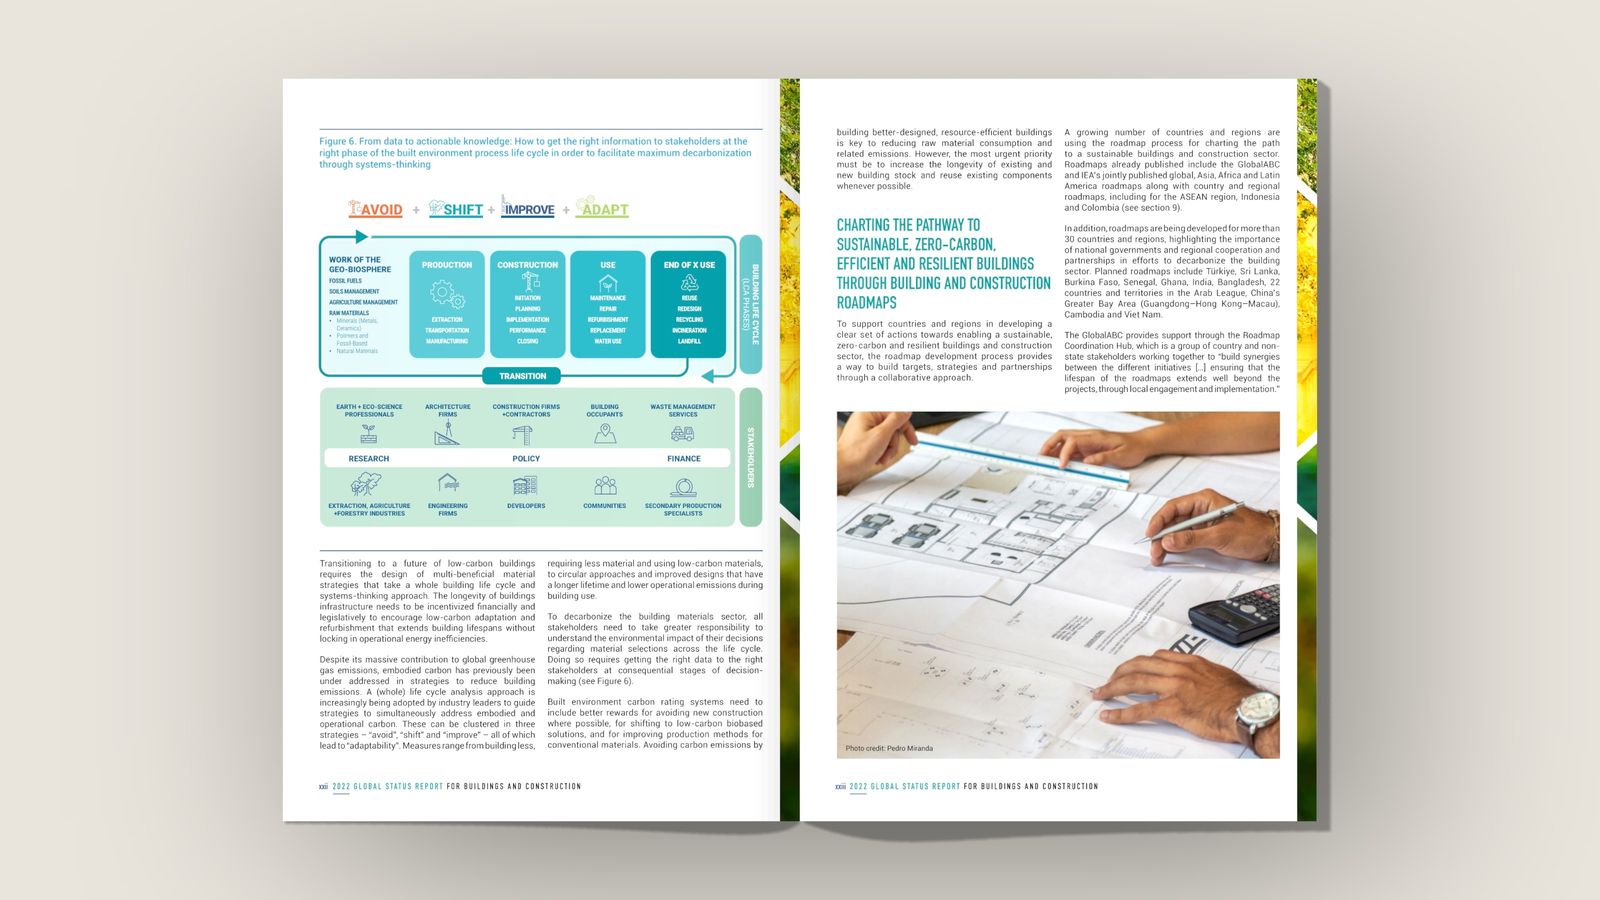
04Diagrams that explain a process on their own.
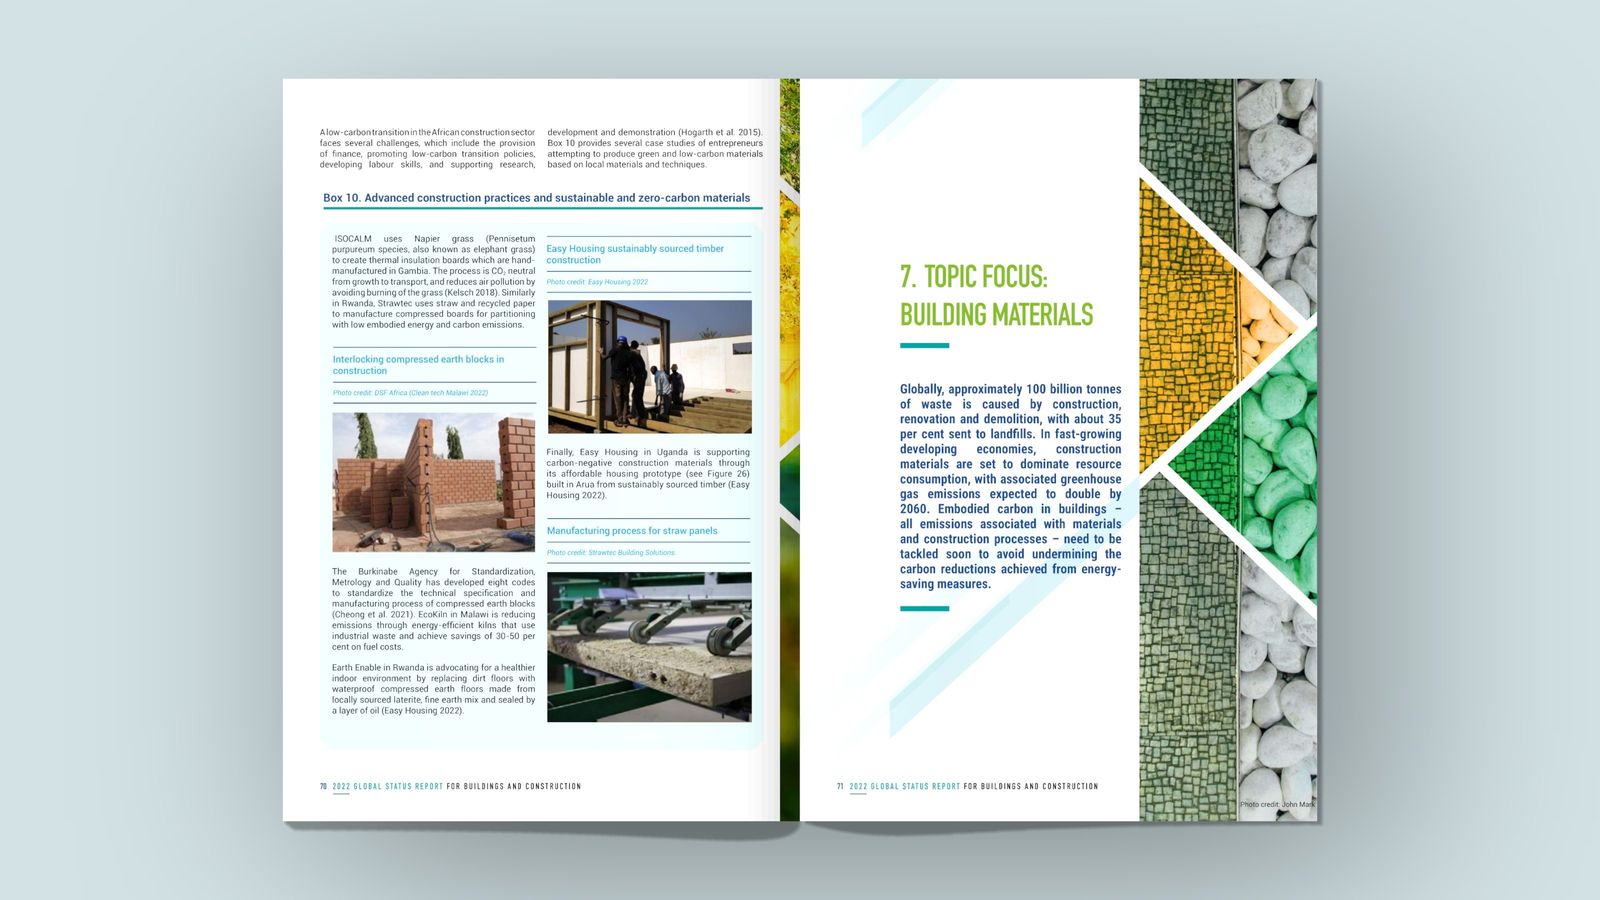
05The topic focus on building materials.
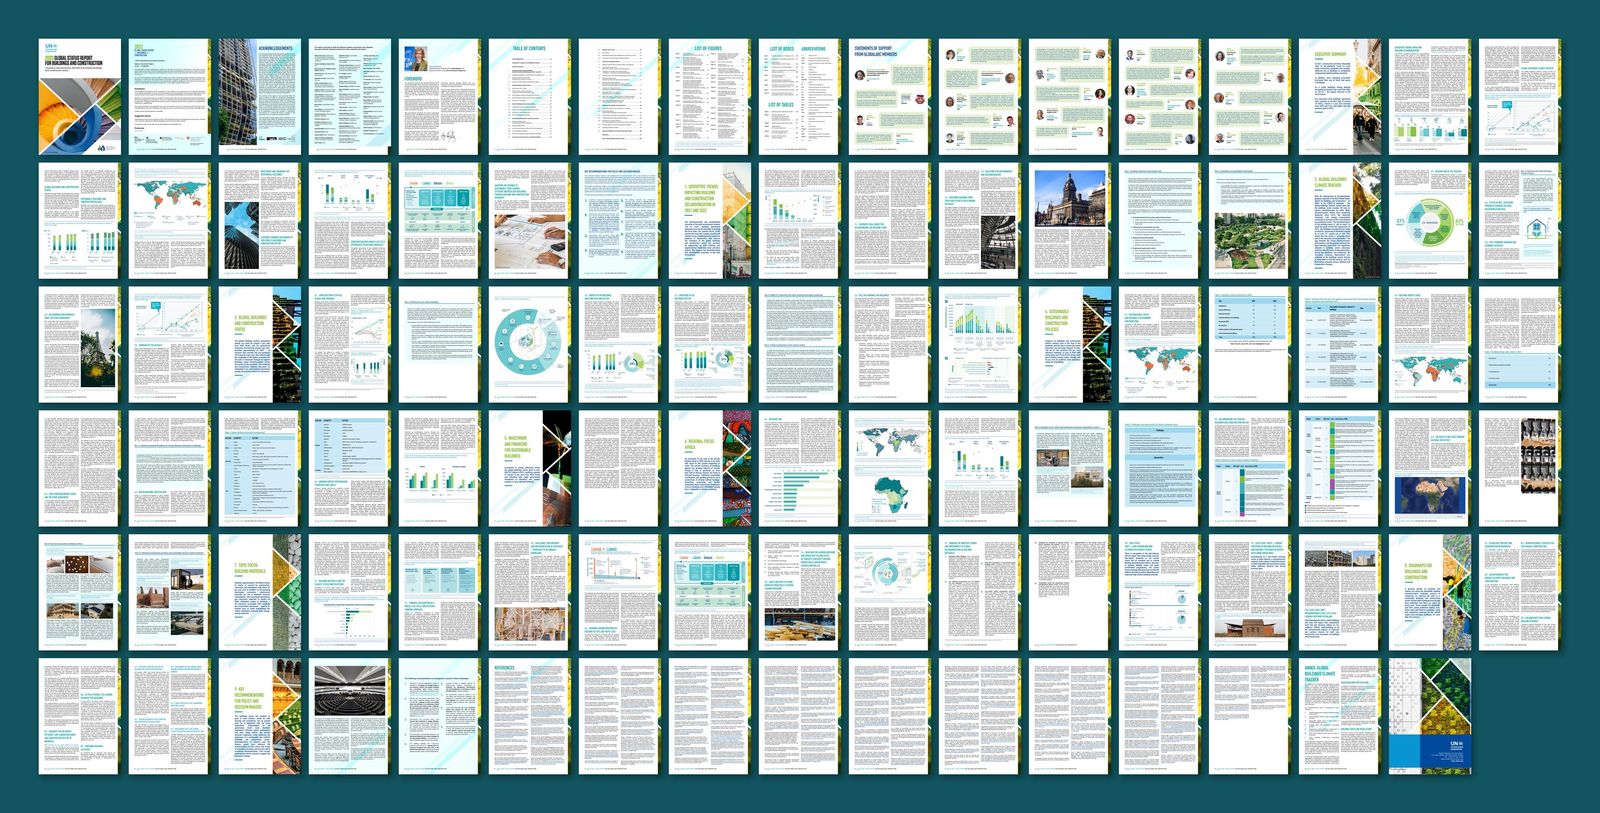
06All 101 pages.
A 101-page report with many kinds of content needed one visual system that keeps the data consistent and the structure easy to follow.
- Format
- A4, 101 pages
- Structure
- Executive summary, nine chapters, annex
- Figures
- 30 figures, 6 tables, 10 boxes
- Authors
- University College London and BPIE, with IEA data
- ISBN
- 978-92-807-3984-8
How we got there
In this case study
The Client
The Global Status Report for Buildings and Construction is published every year by the United Nations Environment Programme (UNEP) and the Global Alliance for Buildings and Construction (GlobalABC). It follows how the buildings and construction sector is moving towards the goals of the Paris Agreement.
The sector matters to that question. In 2021, buildings accounted for around 37 per cent of global CO2 emissions, once the emissions from producing materials such as concrete, steel and glass are included.
The 2022 edition was written by University College London and the Buildings Performance Institute Europe (BPIE), with data from the International Energy Agency (IEA) and comments from reviewers in governments, industry, research and civil society.
The Assignment
We were responsible for the design of the report: the cover and the visual concept, the infographics, and the layout of all 101 pages.
The report is distributed as an A4 PDF, read on screen and printed. Penrose CDB is credited for production on its imprint page.
The challenge
The report holds very different kinds of content. An executive summary and key recommendations for policy makers. The Global Buildings Climate Tracker, an index of the sector's progress since 2015. Chapters on construction activity, energy, emissions, policy and investment. A regional focus on Africa and a topic focus on building materials.
Its readers come to it for different parts. The design had to keep 30 figures, 6 tables and 10 boxes consistent across nine chapters by several authors, and make each part easy to find in a long document.
A visual concept cut from the subject
The cover sets out the idea. Photographs of buildings and materials are cut along diagonal lines into angular panels, a little like the facets of a structure seen from different sides.
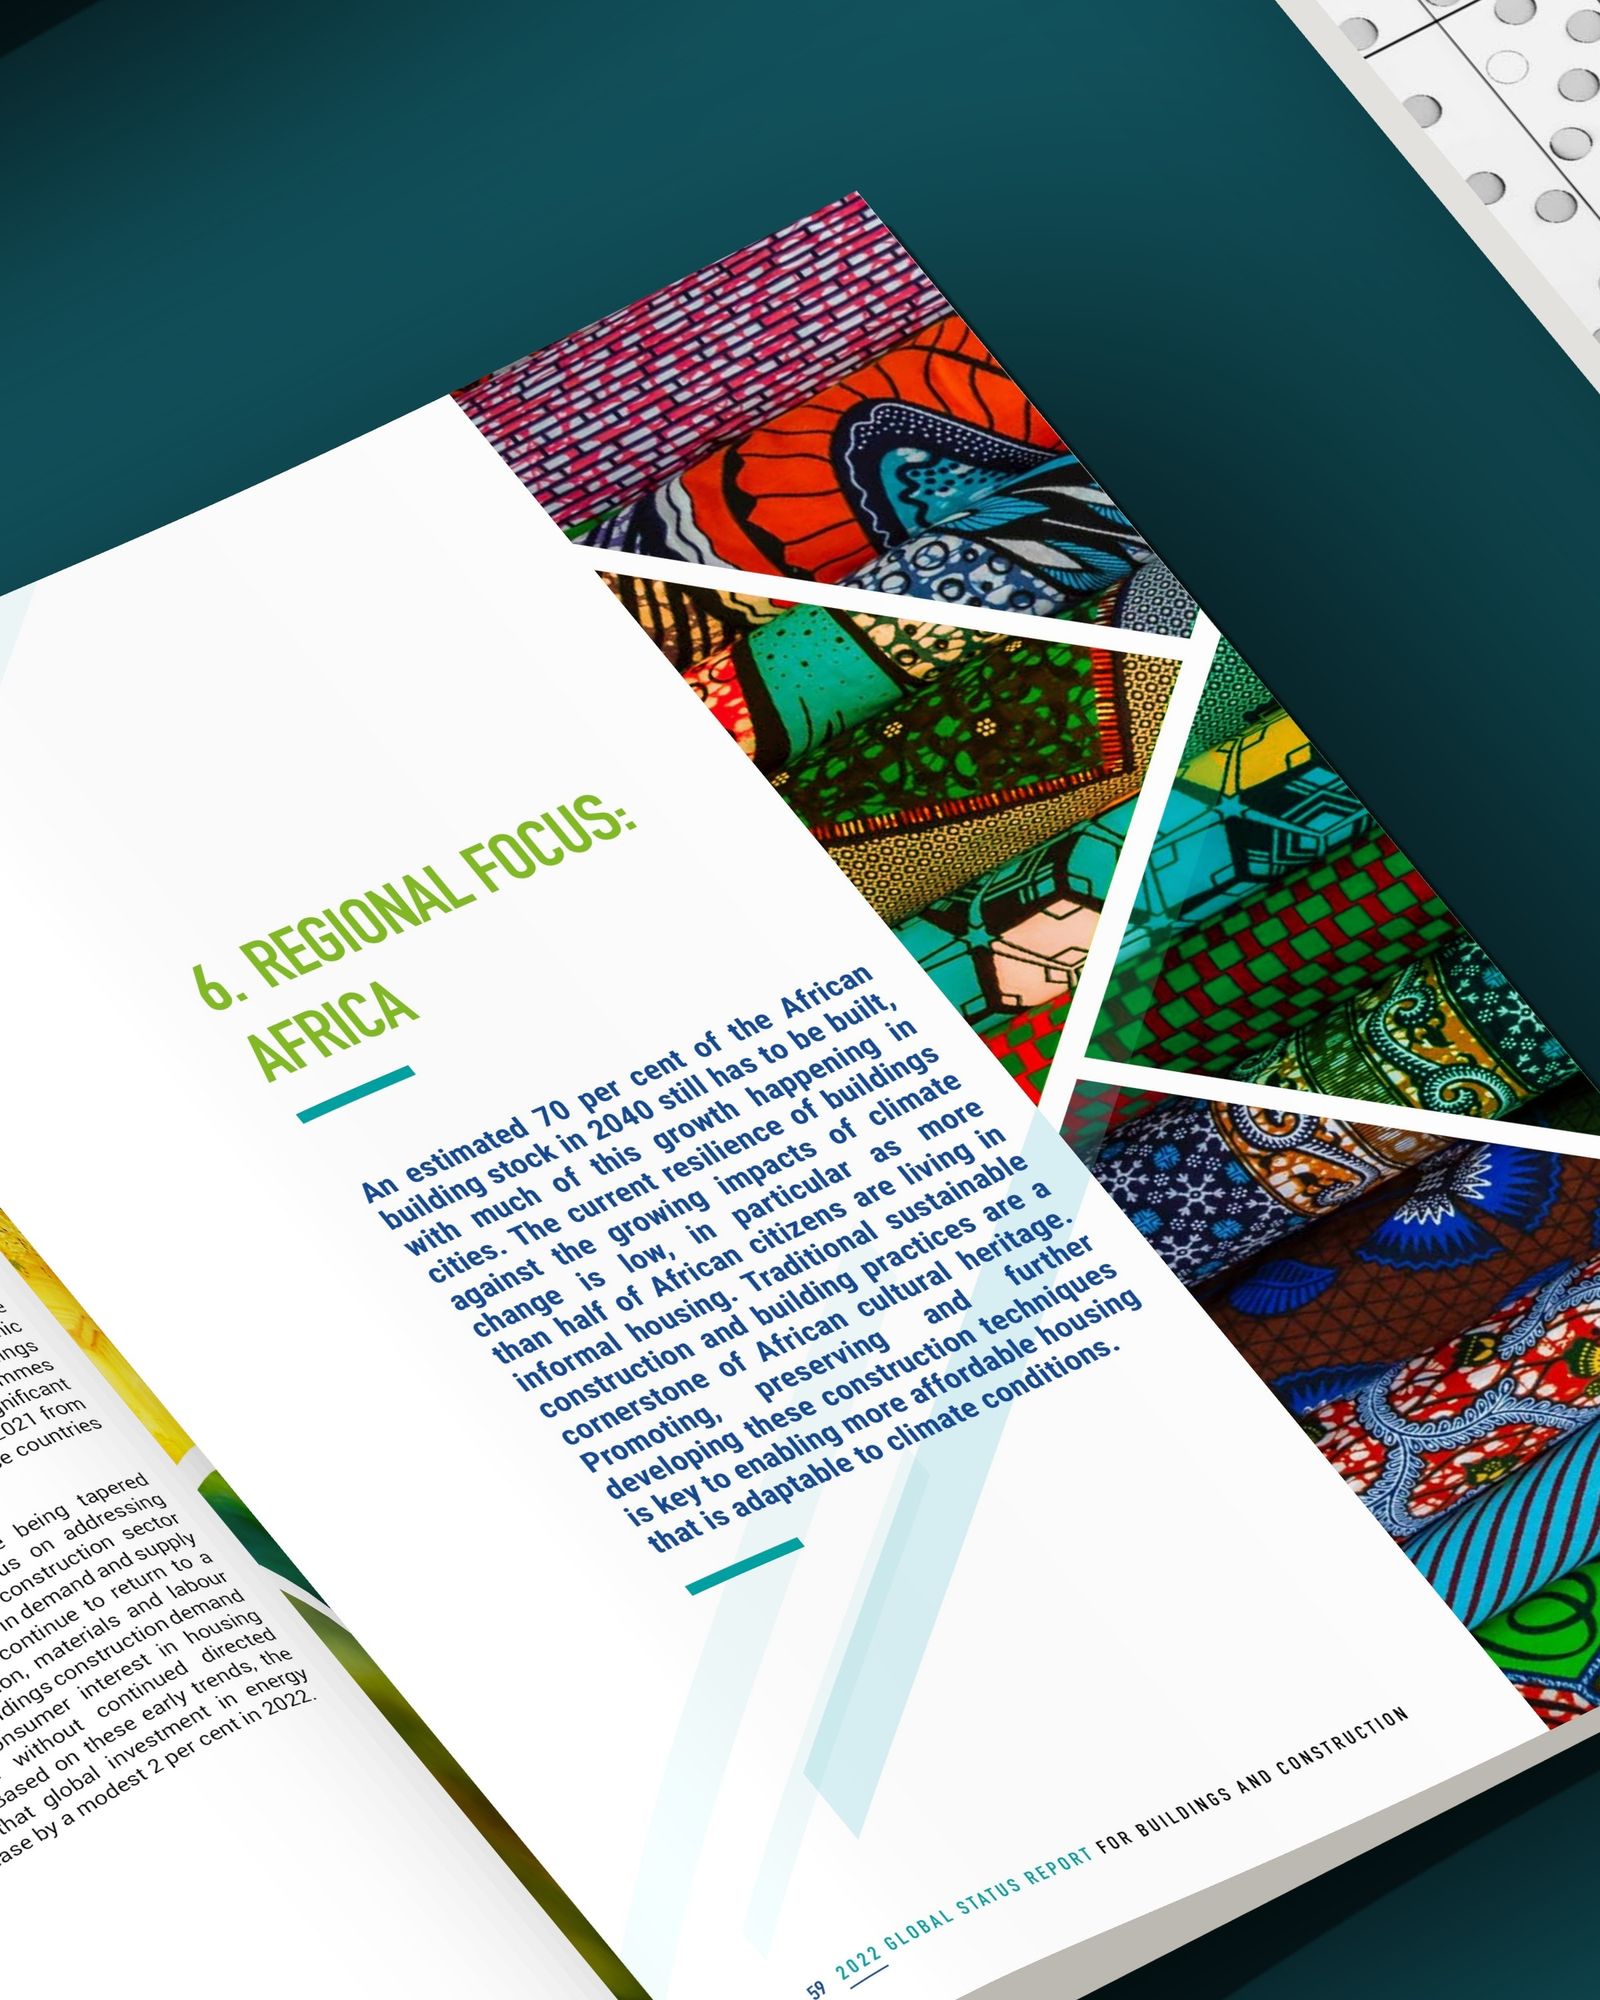
The same cut opens each of the nine chapters, with photography chosen for the subject: green walls for the climate tracker, printed textiles for the Africa focus, raw materials for the chapter on building materials.
Chapter titles and section headings are set in a condensed typeface in blue and green. They stand apart from the running text and make the structure of the report visible as the reader moves through it.
Making the data readable
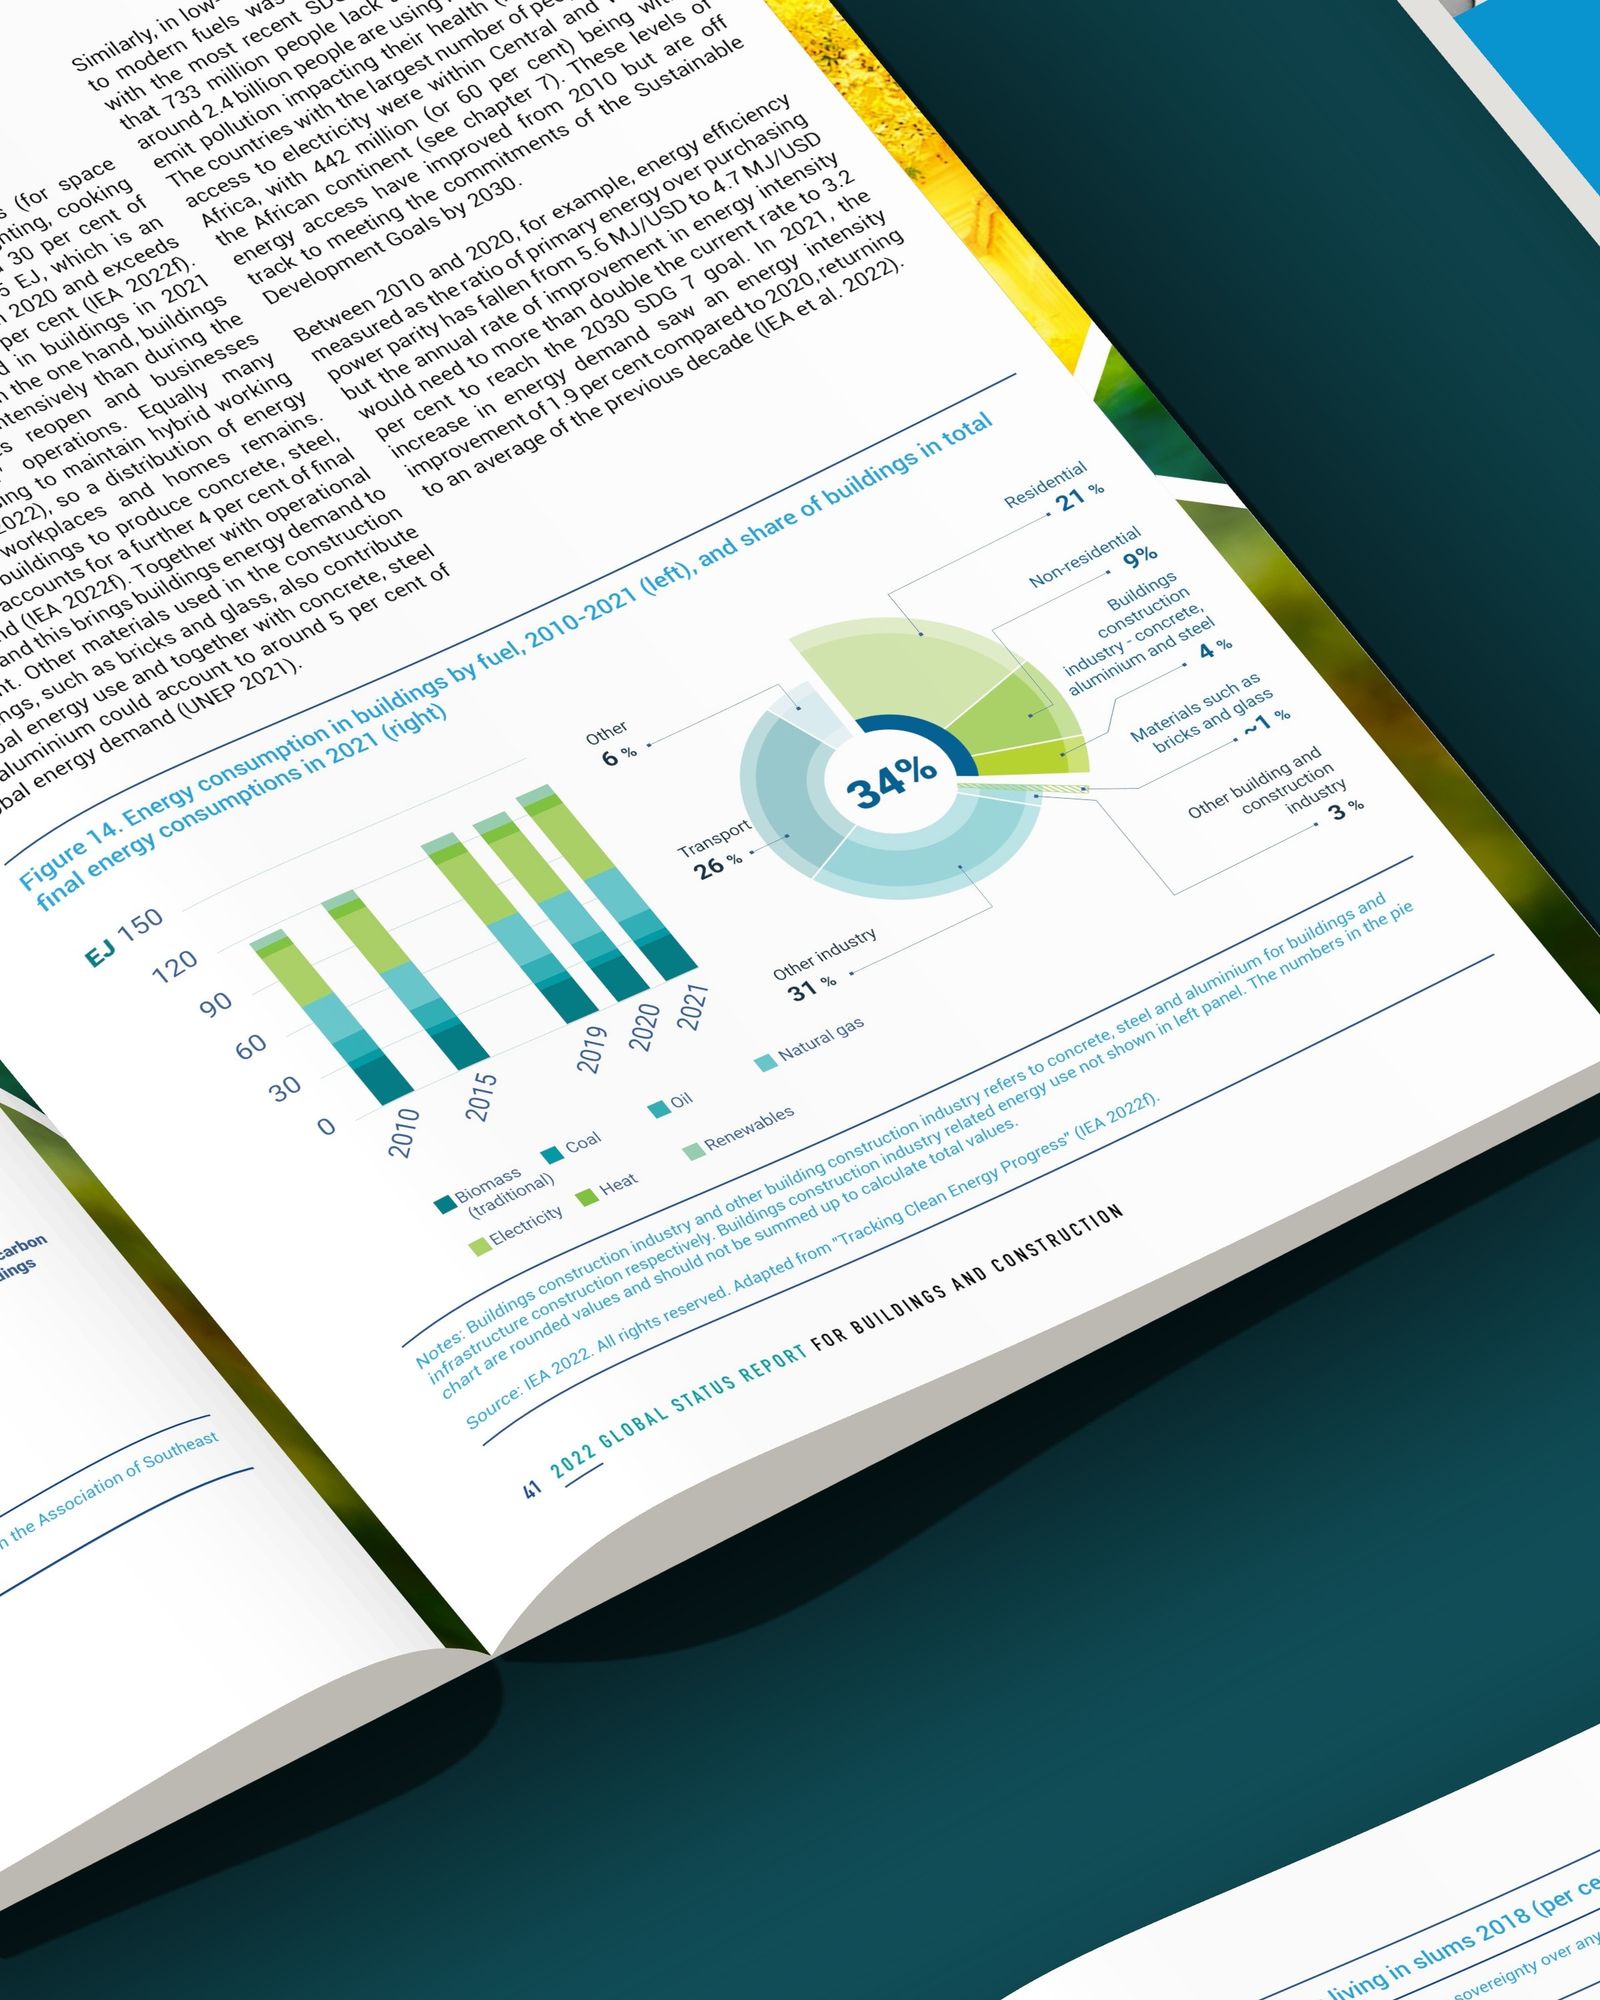
Every chart, map and diagram was redrawn in the same palette and type, whether the source was the IEA, the Intergovernmental Panel on Climate Change (IPCC) or national data.
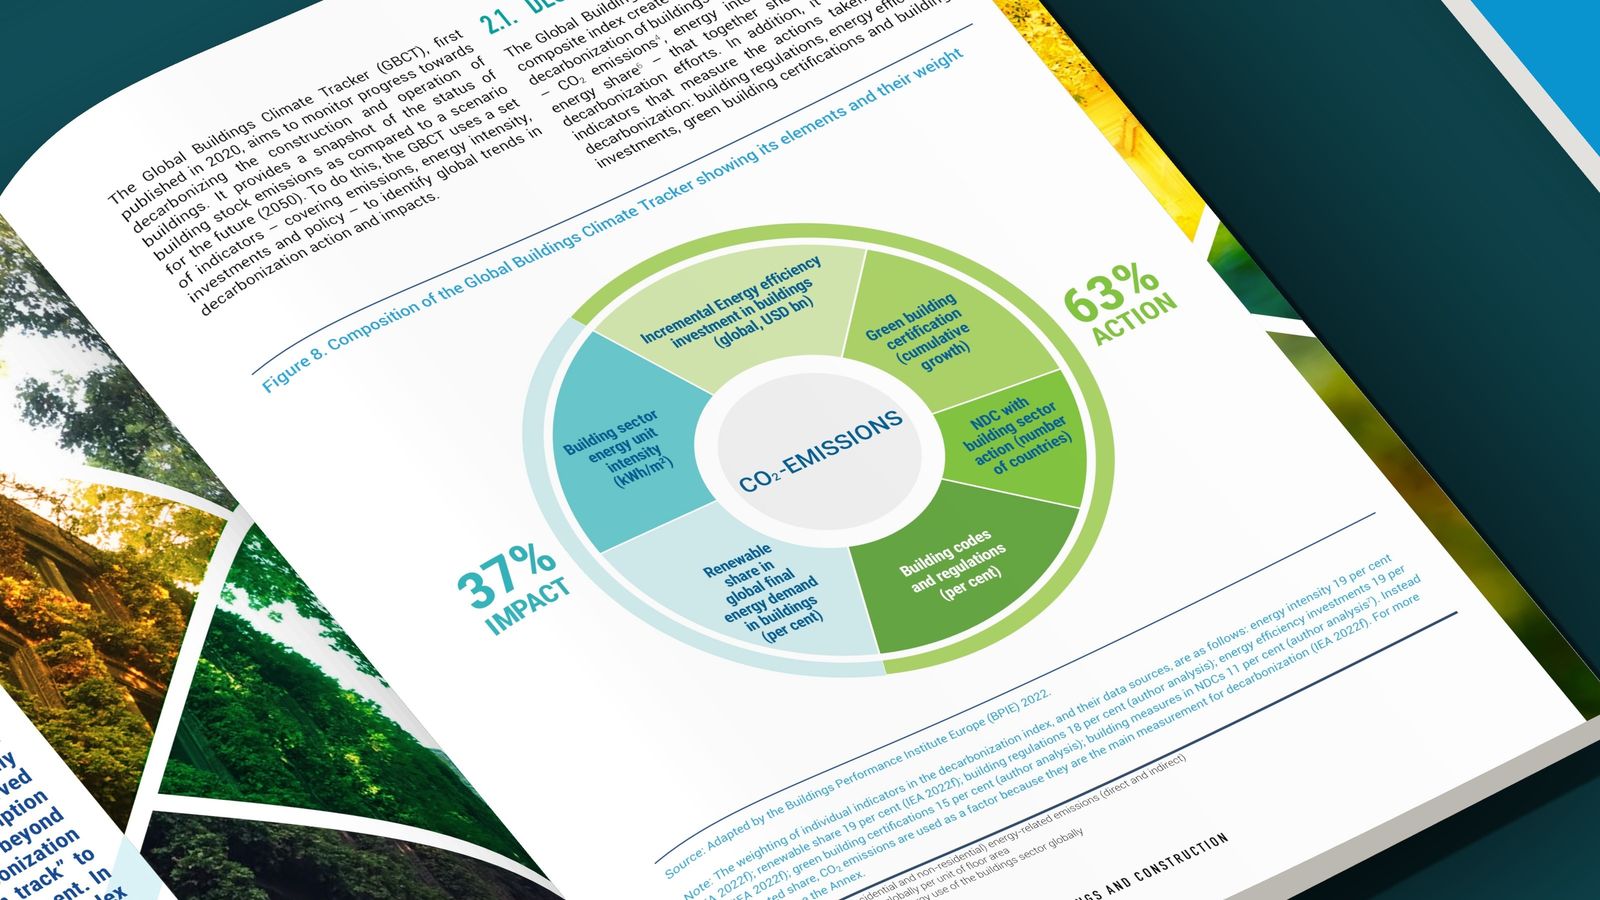
The Global Buildings Climate Tracker combines indicators on emissions, energy intensity, investment and policy into a single index. We drew it as a ring that separates the indicators that measure impact, which carry 37 per cent of the weight, from those that measure action, which carry 63 per cent.
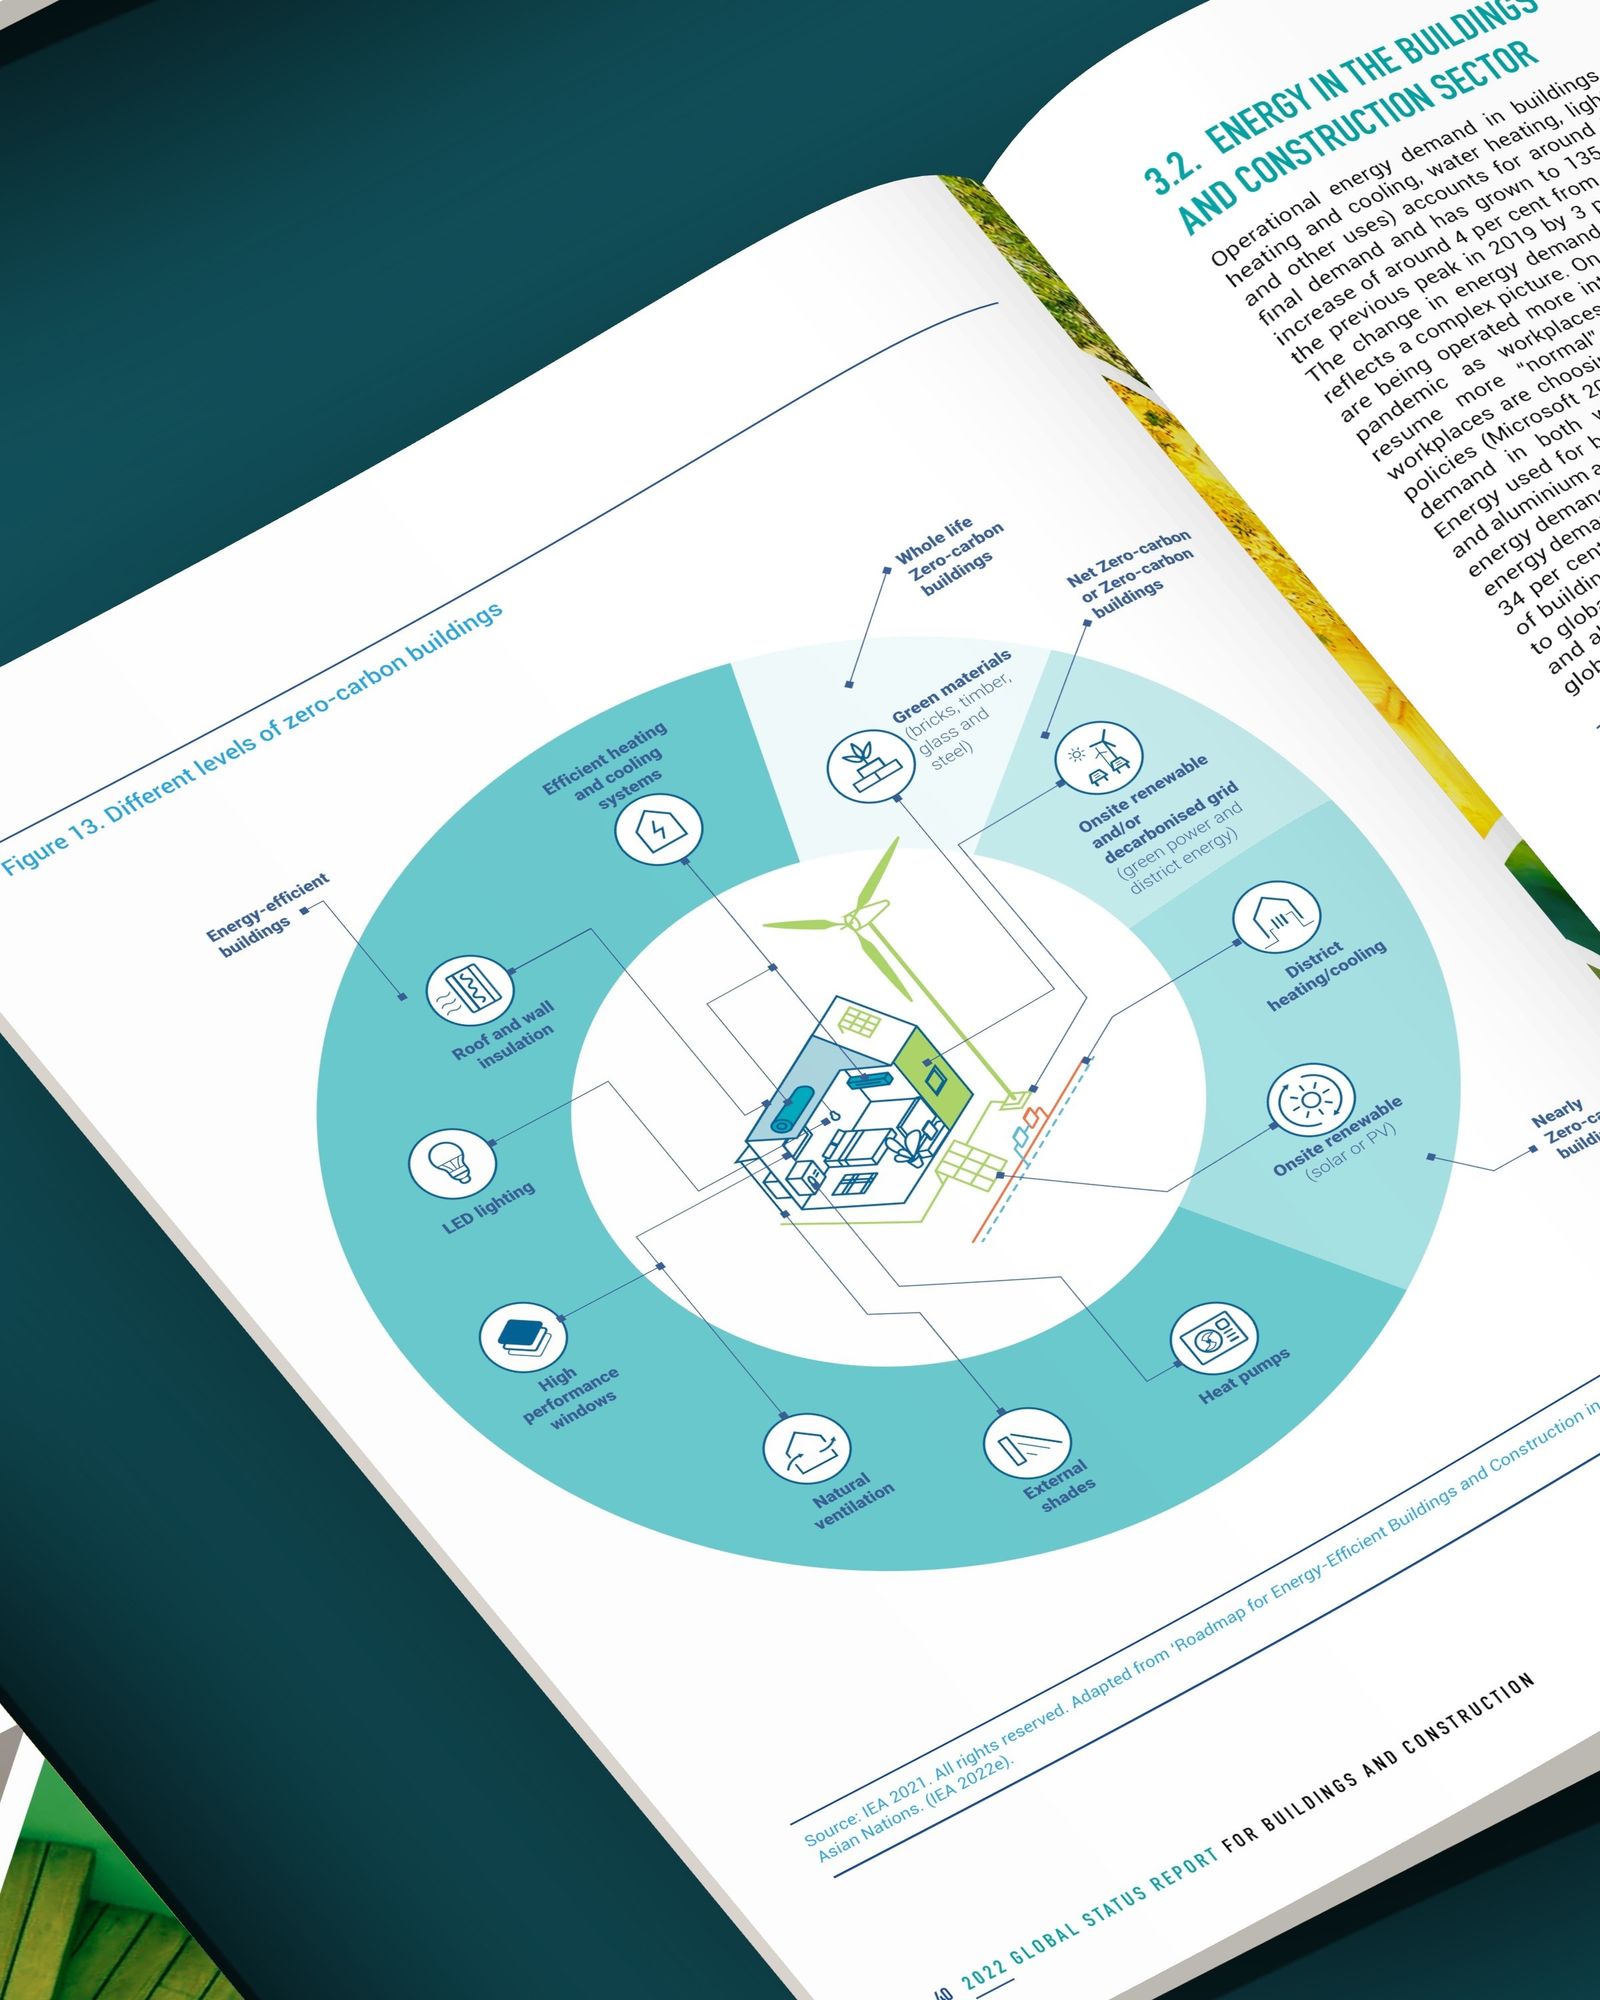
Larger diagrams are written to work on their own. The levels of zero-carbon buildings, for example, move step by step from energy-efficient buildings to buildings that are zero-carbon across their whole life cycle.
A focus on Africa and on materials
The 2022 edition looks closely at Africa, where an estimated 70 per cent of the building stock in 2040 still has to be built. The chapter needed maps at global and continental scale, projections of energy demand to 2030 and examples of low-carbon and traditional construction.
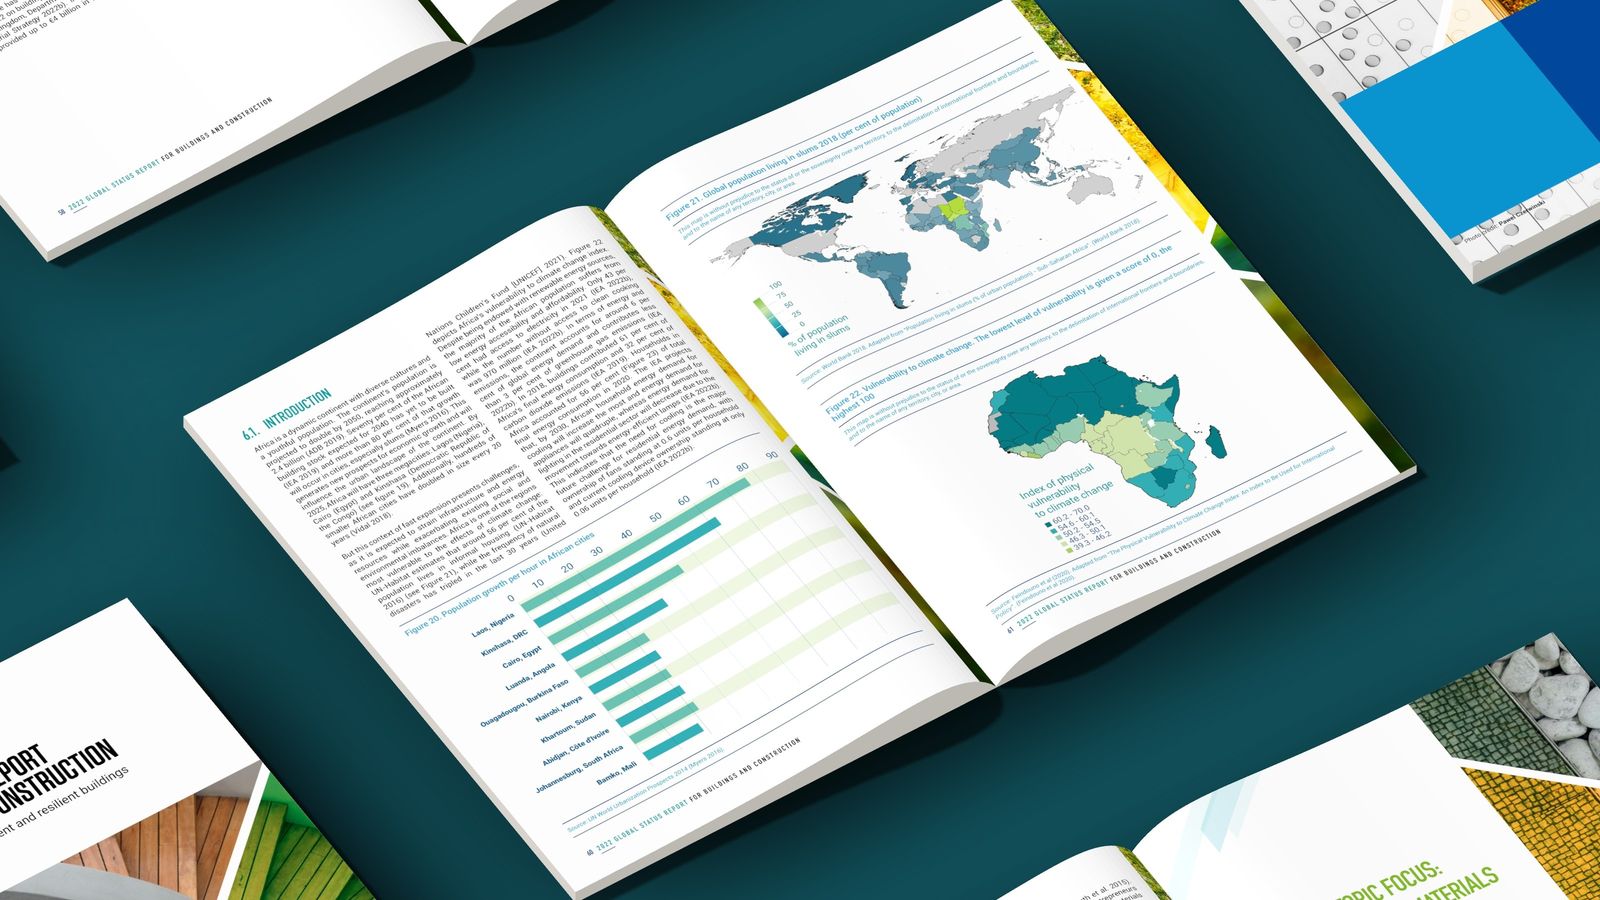
Case studies sit in boxes with their own photography, from sandbag houses in Cape Town to a headquarters in Thiès, Senegal, built with compressed earth blocks made from local materials.
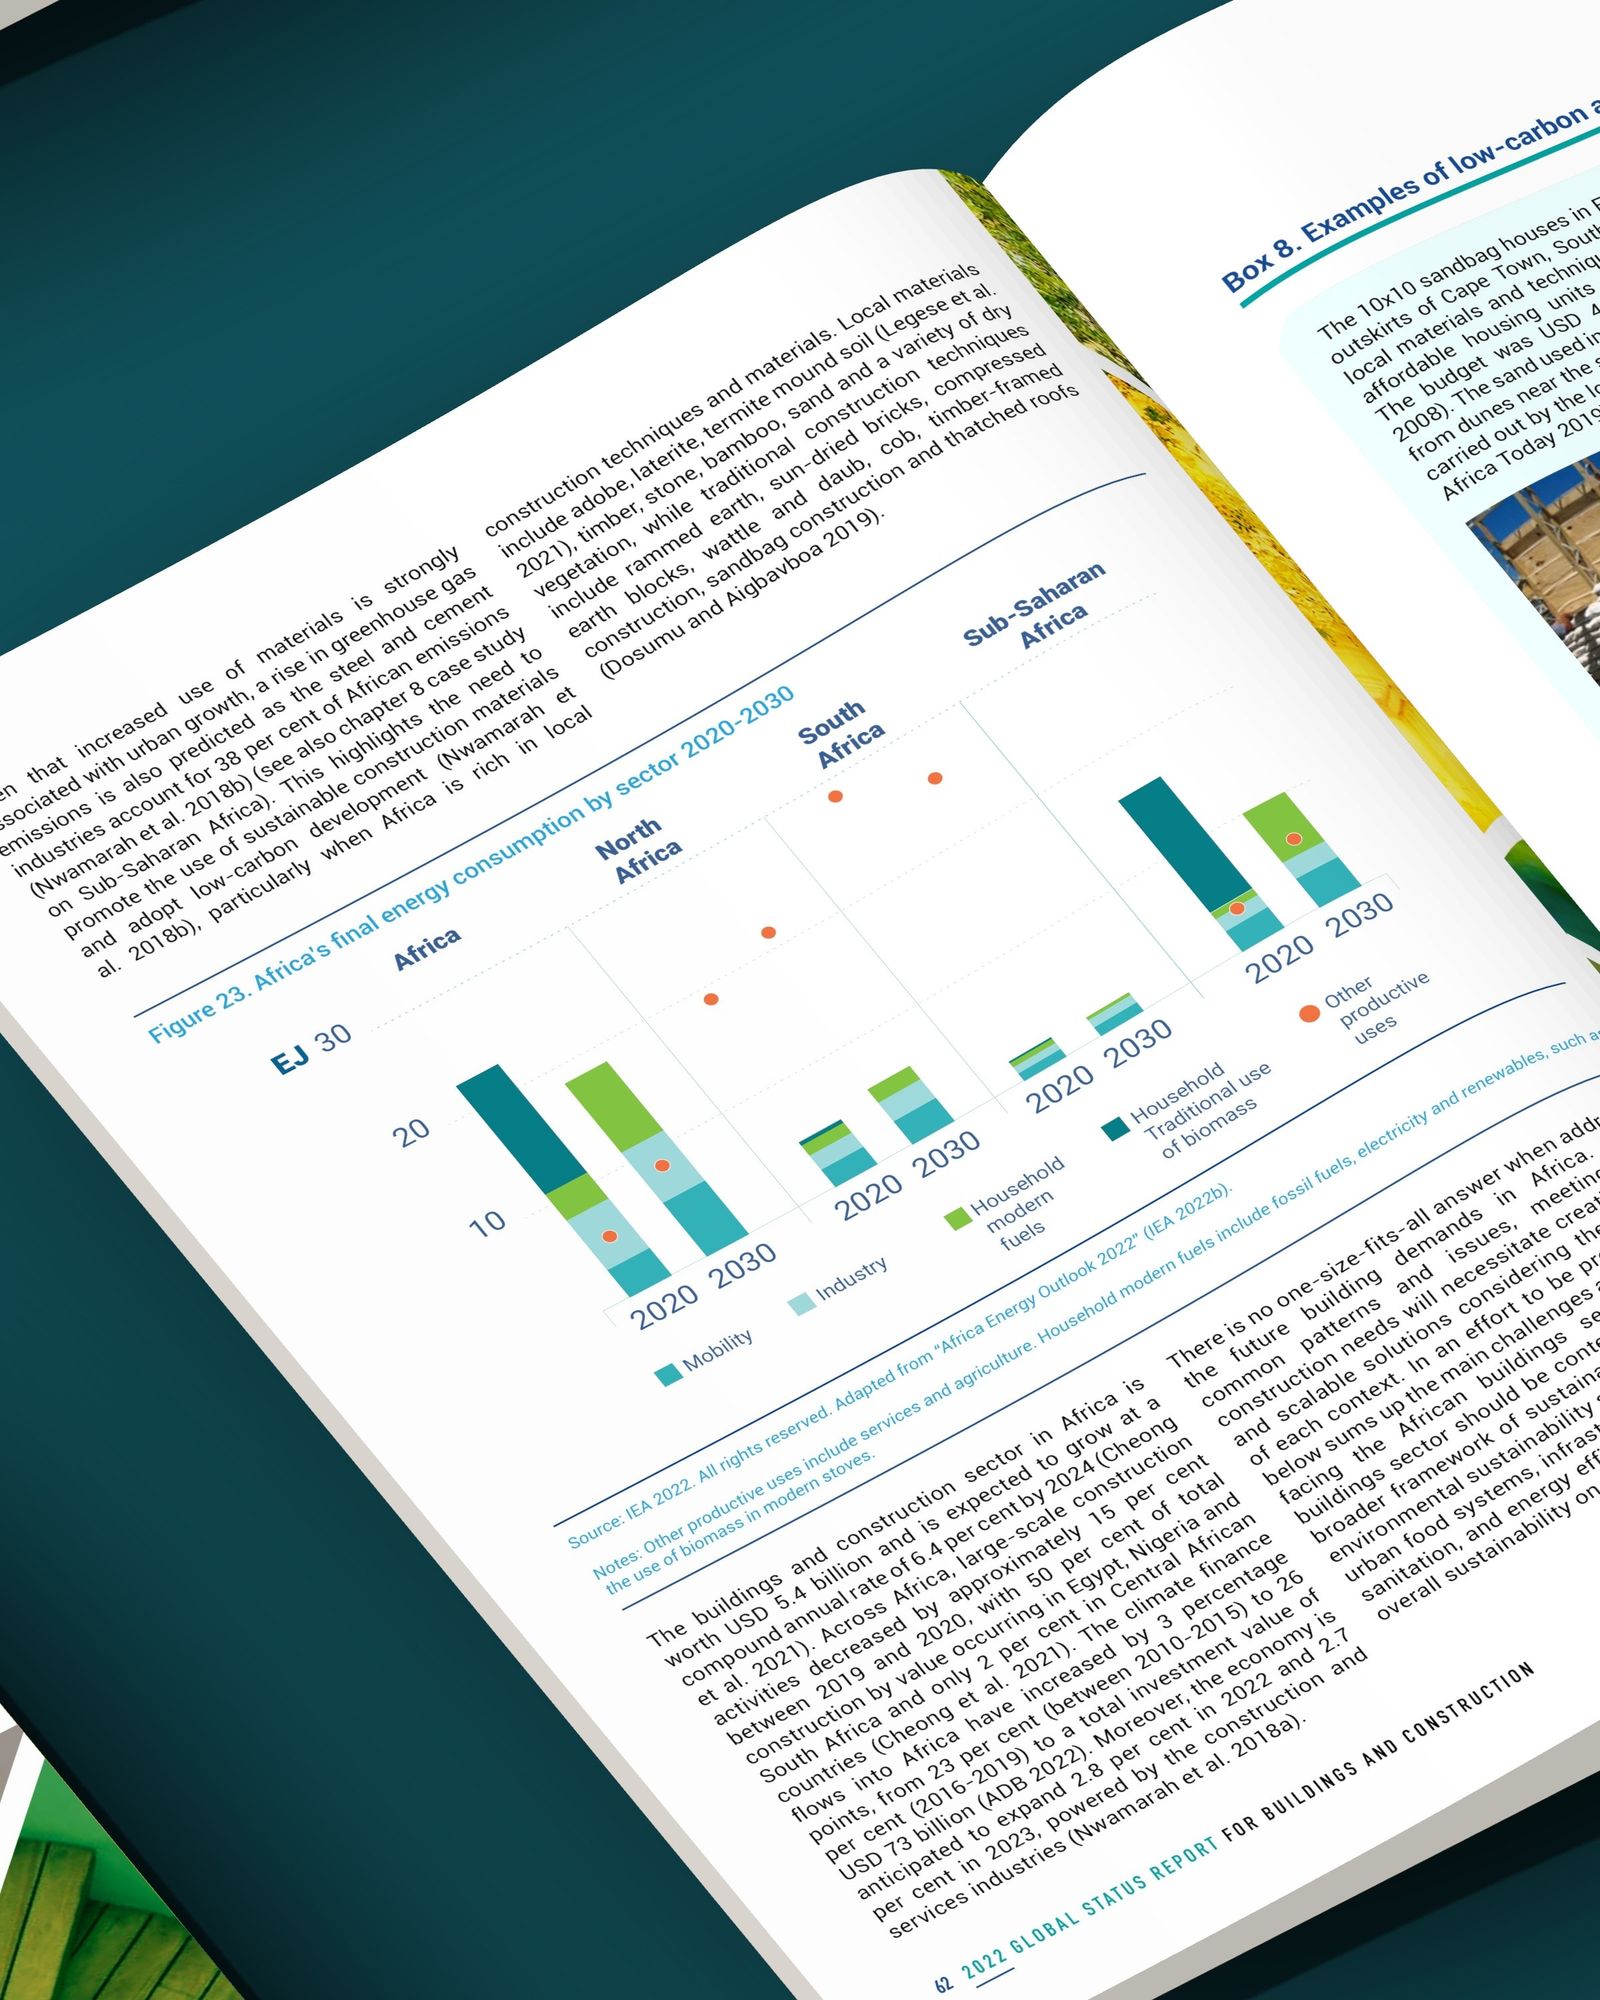
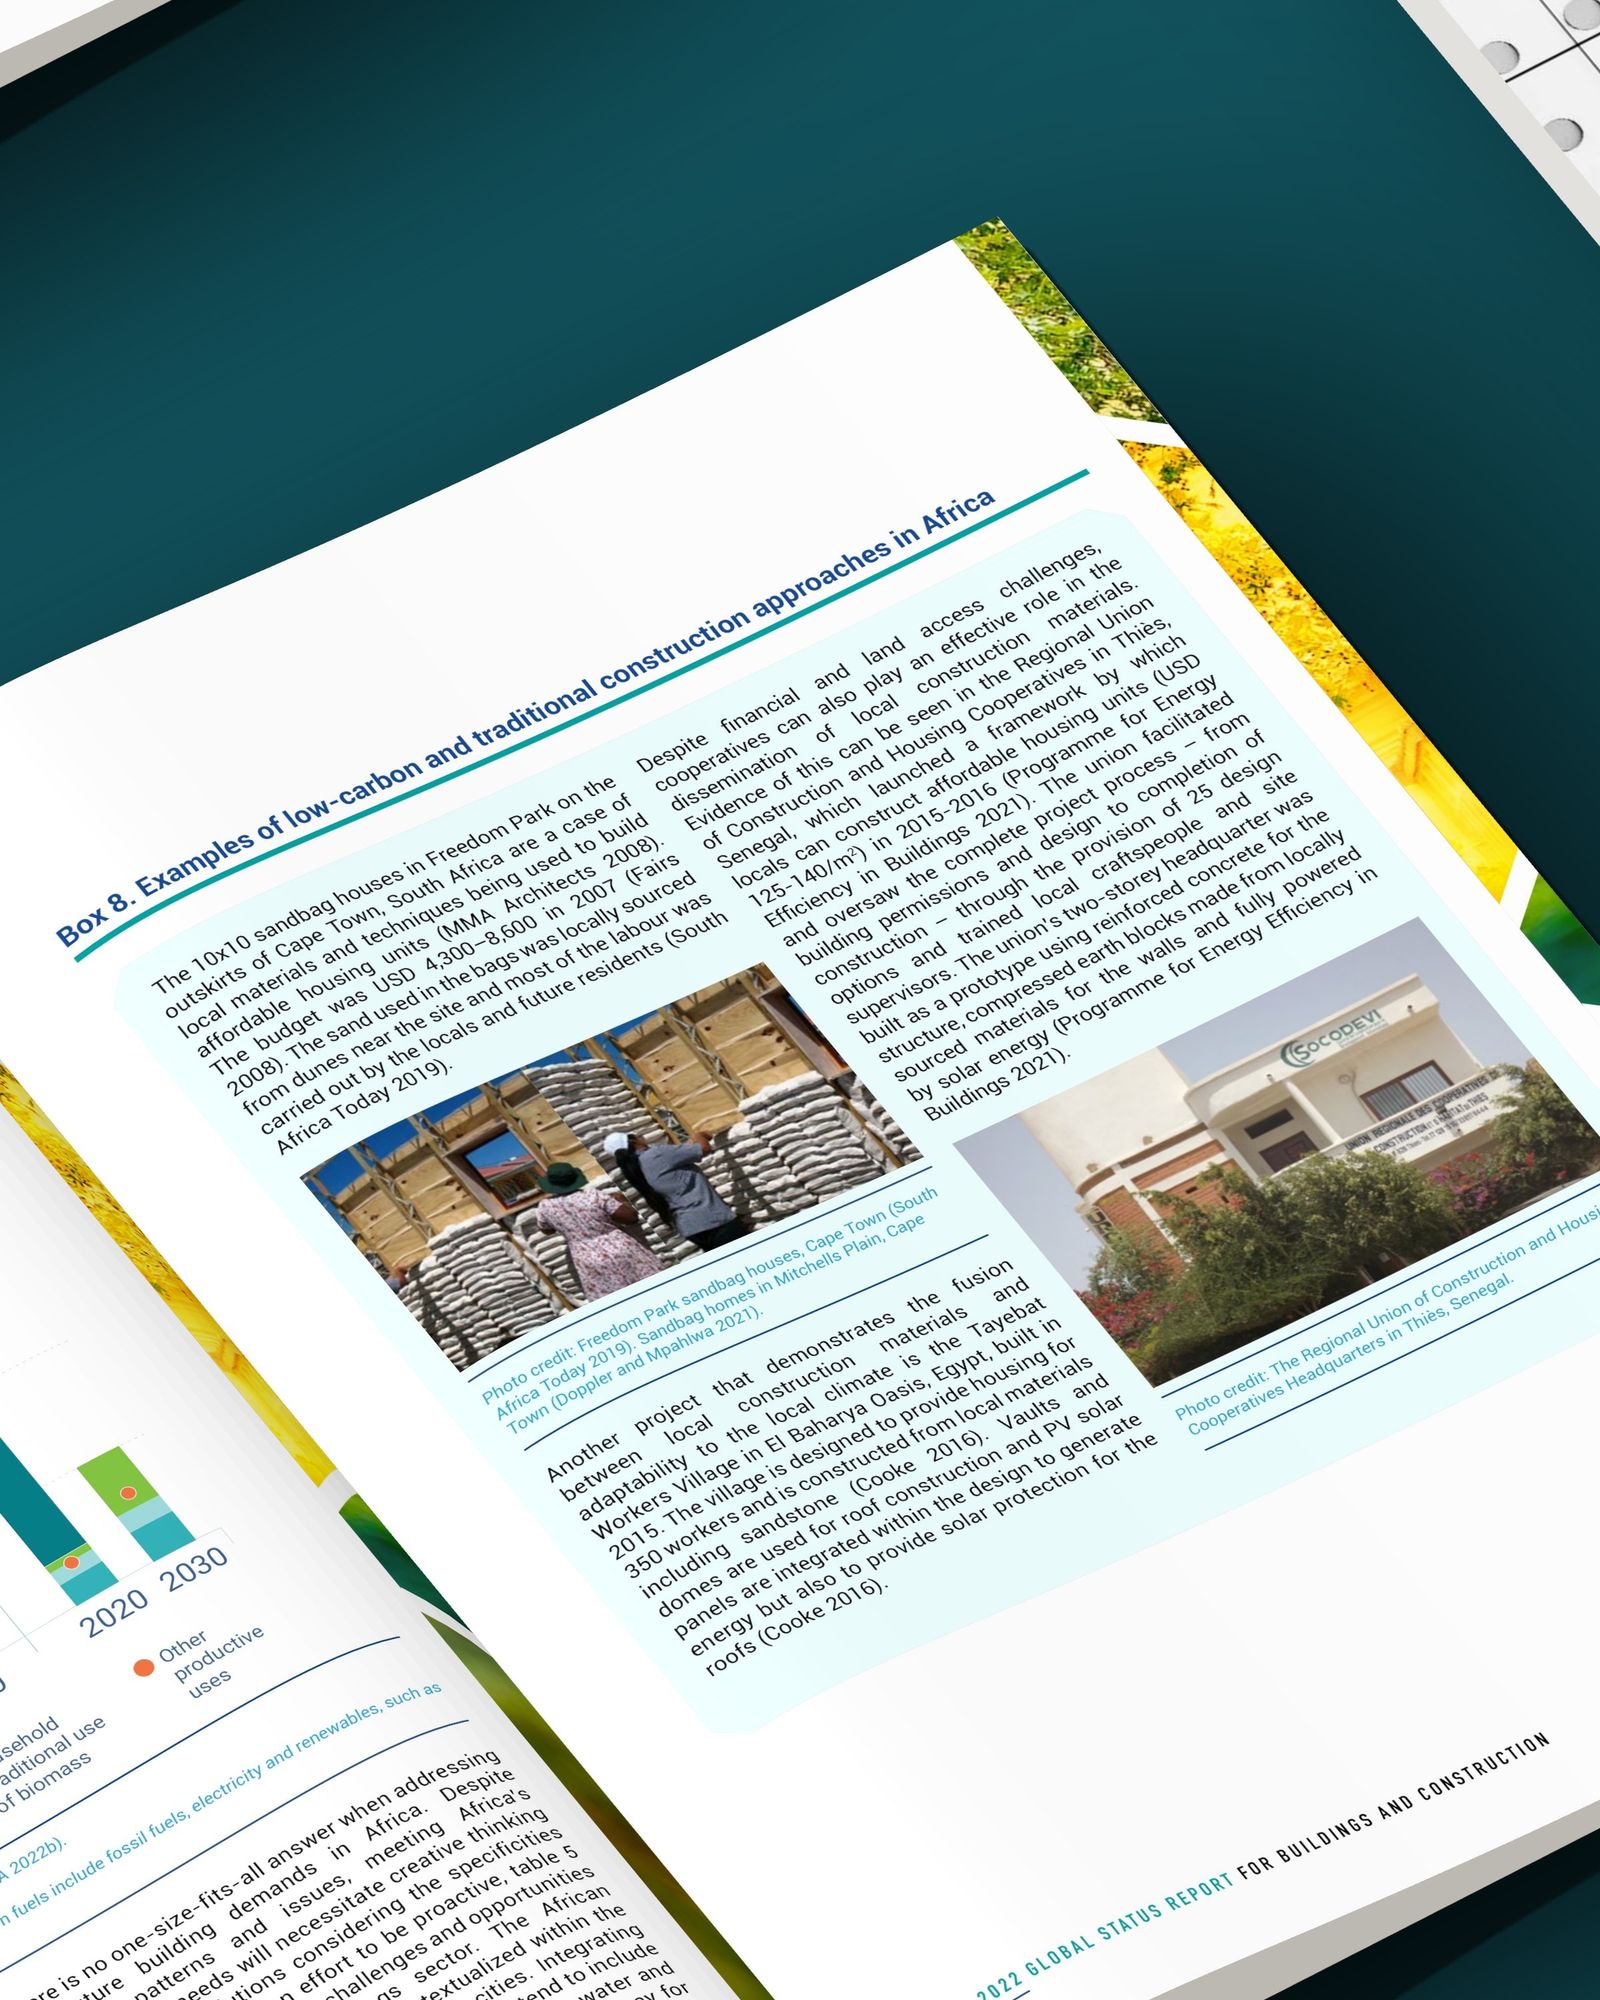
The chapter on building materials follows, with diagrams on embodied carbon, life cycles and green infrastructure.
The finished report
The report opens with statements of support from GlobalABC members and an executive summary that leads with the year's headline figures: energy demand in buildings up around 4 per cent to 135 exajoules, and operational CO2 emissions at an all-time high of around 10 gigatonnes.
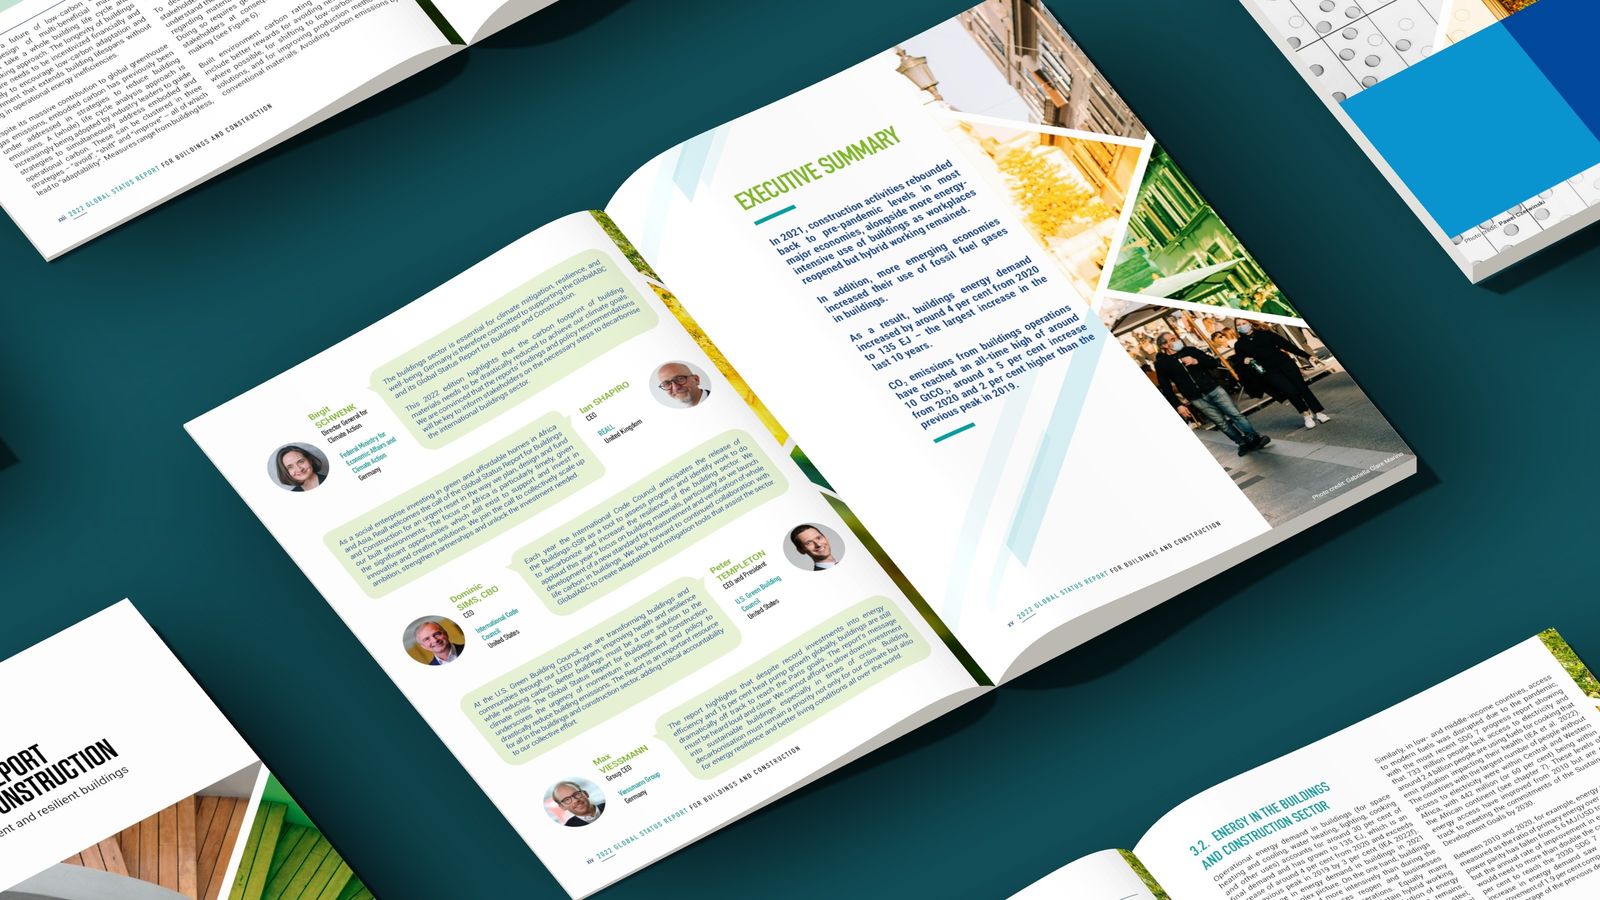
It closes with nine recommendations for policy and decision makers and an annex describing how the Global Buildings Climate Tracker is calculated.
Penrose
- Visual concept
- Infographics
- Layout